
Aug 6, 2026
What Counts as a Real Instagram Follower? 2026 Benchmarks
Real followers on Instagram engage. Compare engagement rate by follower tier, learn which formula to use, and spot when a low number is not fake followers.
 Melissa Tan 陈慧敏1,400 words6 min read
A brand is vetting two creators. The first has 40,000 followers and a 1.6% engagement rate. The second also has 40,000 followers and a 4.1% engagement rate. The choice looks obvious. But check the content format and the picture flips: the second creator posts almost exclusively Reels, the first posts carousel tutorials. Reels average 3.8% engagement, static posts average 1.2%. Normalized for format, the first creator is the stronger performer, and her audience is 71% US against the second creator's 22%. The number that looked bad was the wrong number.
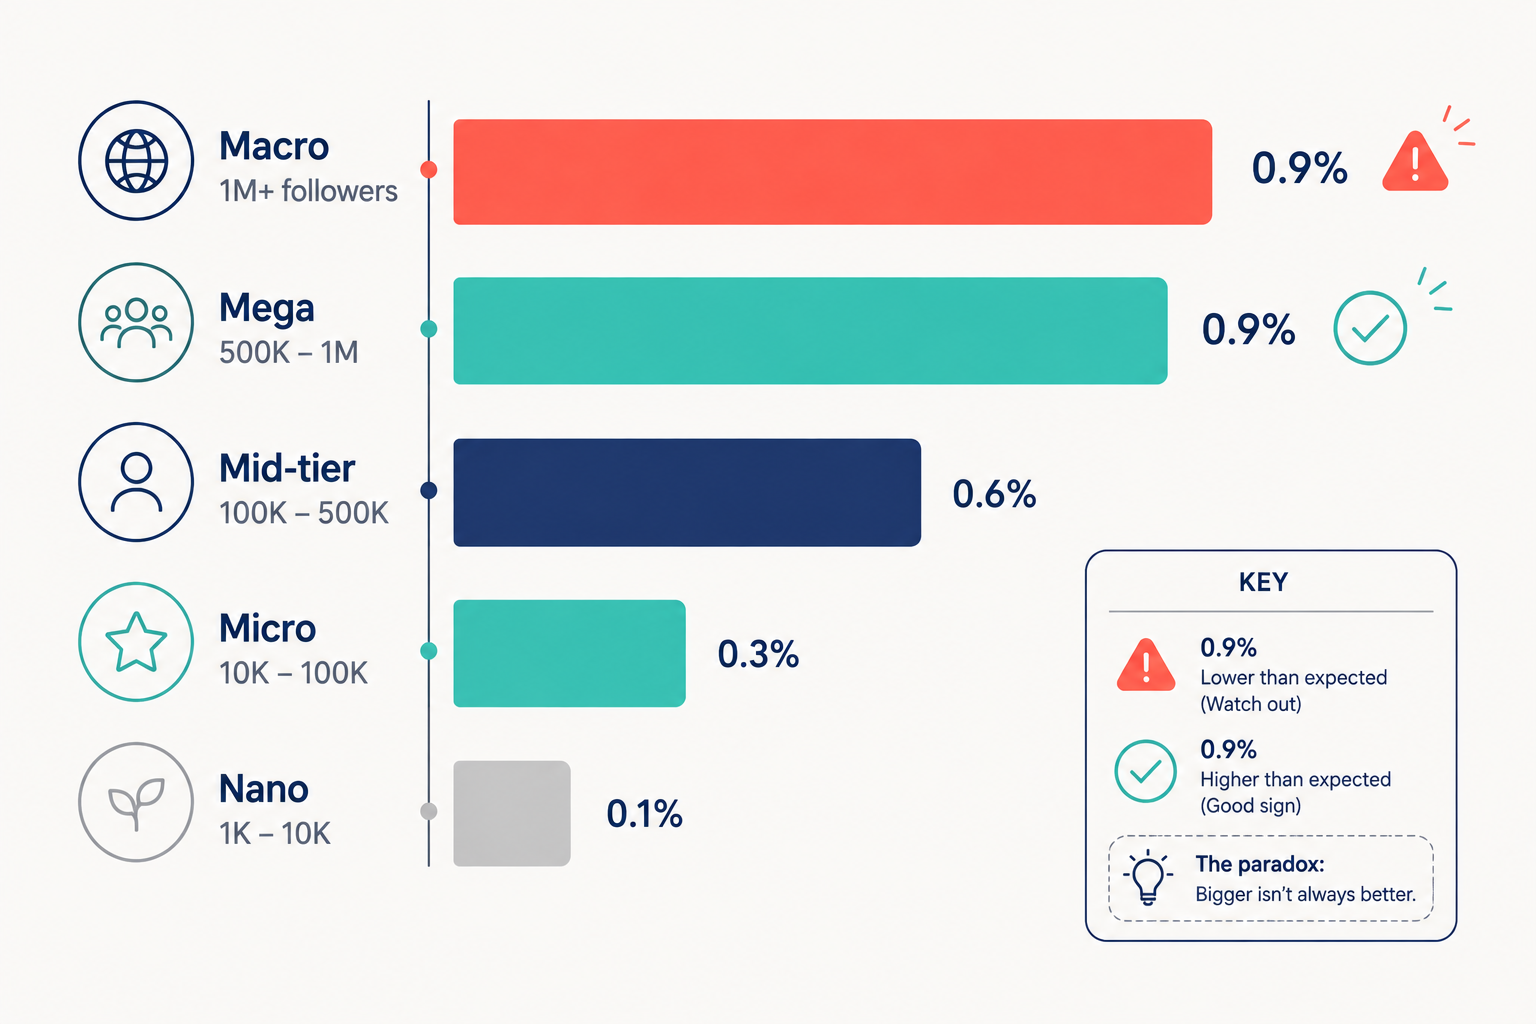
That's why there's no universal pass mark. A real follower on Instagram is an account that actually interacts with the creator's posts, and since you can't count them directly, you judge by engagement rate against tier. Nano accounts run roughly 3.5 to 6%, micro 1.5 to 3.5%, and most mega accounts sit under 1%. Here's where it trips people up: a 0.9% engagement rate is a red flag on a 20,000-follower account and completely normal on a 3 million-follower one. Same number, opposite conclusion.
There's a subtler trap underneath all of this. Three different formulas are in circulation — by followers, by reach, and by views — and the same account produces very different numbers depending on which one you use. Most benchmark posts quietly mix all three, which is why the numbers you find never seem to agree.
Key Takeaways
• Real followers are measured by engagement, not counted. Rate against tier is the practical test.
• Three formulas circulate (by followers, by reach, by views). Numbers from different formulas are not comparable.
• Nano runs 3.5 to 6%; micro 1.5 to 3.5%; macro and mega 0.4 to 0.9%. Smaller accounts engage harder.
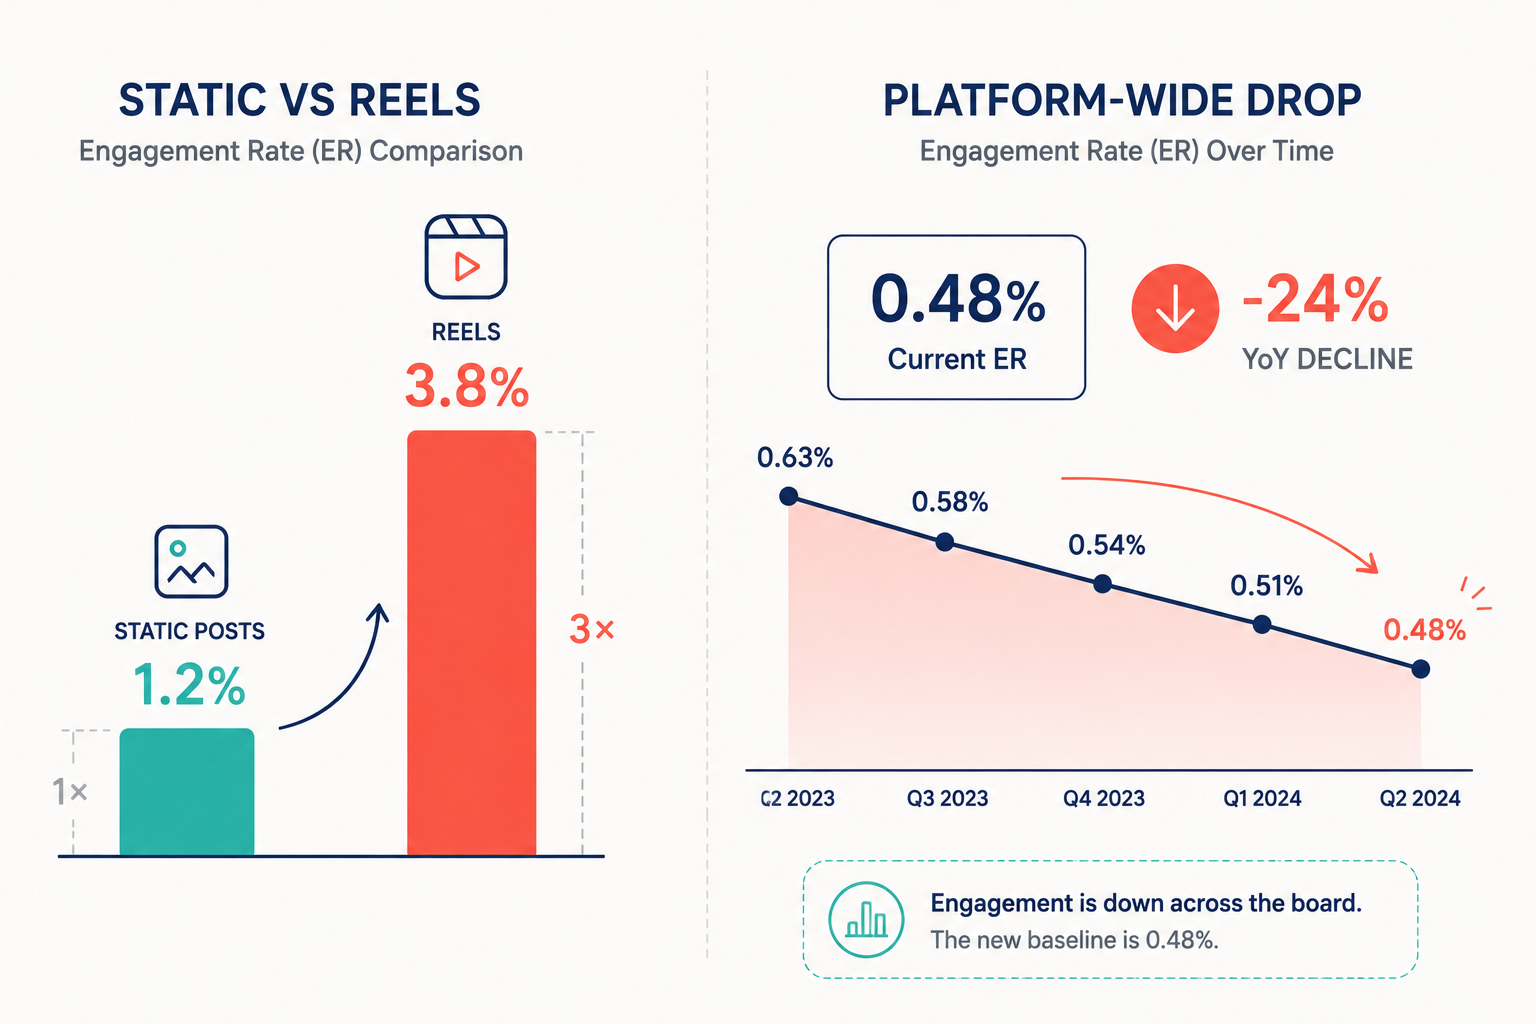
• Format matters more than tier: static posts average 1.2%, Reels 3.8% — a 3x gap inside the same account.
• Instagram's platform-wide engagement fell to 0.48% in Q1 2026, down 24% year over year. Any benchmark older than a year reads high.
The Formula Problem Nobody Mentions
Three formulas are in common use and they produce very different numbers for the same account.
By followers: (average likes + comments) ÷ follower count × 100. The only one you can calculate from a public profile — use this for vetting someone else.
By reach: engagement ÷ accounts reached × 100. Much higher, because it counts only people who saw the post. This is what creators quote in media kits.
By views: engagement ÷ video views × 100. Used for Reels-heavy accounts.
The gap is not small. A creator at 2% by followers might show 8% by reach. Neither is wrong — but compare a by-followers calculation to a by-reach benchmark and every creator you look at will seem to be underperforming.
Rule: pick one formula and compare only within it. Everything below uses by-followers.
Engagement Rate Benchmarks by Follower Tier
Three sources, three sets of numbers. That disagreement is real and worth seeing rather than averaging away.
Tier | Range A | Range B | Range C |
|---|---|---|---|
Nano (1K to 10K) | 5 to 10% | 3.5 to 6% | ~7% median |
Micro (10K to 100K) | 3 to 6% | 1.5 to 3.5% | ~3.5% (10K to 50K) |
Mid (100K to 500K) | 1.5 to 4% | not reported | ~1.6% (50K to 500K) |
Macro (500K to 2M) | 1 to 2.5% | not reported | 0.4 to 0.9% |
Mega (2M+) | 0.5 to 1.5% | not reported | 0.4 to 0.9% |
Sources: Influencerfee (A), Nowadays.media from 15,000+ creator accounts (B), Virallized (C).
Why the spread? Partly formula, partly tier boundaries — some sources define nano as under 1,000 followers, others as 1,000 to 10,000. Check the definition before applying a number.
Practical read: treat Range B as your working baseline, since it's the largest disclosed sample. Use the others as a sanity range. Inside all three, you're fine. Below all three, look harder.
Want to skip the arithmetic on a specific account? The fake follower checker returns average interaction, views per follower, and an estimated real-versus-suspicious split from a profile URL.
Two Things That Matter More Than Tier
Format beats tier. Static posts average 1.2%. Reels average 3.8%. A carousel-heavy creator looks weak against a Reels benchmark, and a Reels creator looks like a superstar against a blended one. Compare format to format or you're measuring the wrong thing.
The whole platform is sliding. Socialinsider put Instagram's platform-wide rate at 0.48% in Q1 2026, down 24% year over year, while TikTok, Facebook, Pinterest and X all went up. This matters for a boring reason: most benchmark articles were written before that drop and never updated. A 2024 post saying "3% is average for micro creators" was true then and reads high now.
When a Low Rate Is Not Fake Followers
A rate under benchmark is a reason to investigate, not a verdict. Three legitimate explanations come up constantly:
- Format mix. Carousel-heavy accounts run structurally lower.
- Posting frequency. Five posts a day splits the same attention five ways. Per-post engagement drops while total holds.
- Vertical. B2B, finance and industrial sit well below beauty and food at every tier. A 1.1% finance micro-creator may be top of their category.
Consider a skincare brand vetting two beauty creators, both around 40,000 followers. The first shows 4.1% and looks like the obvious pick. The second shows 1.6%, which reads like a fail. Then check format: the first posts Reels almost exclusively, the second posts carousel tutorials. Normalized to format, the second is stronger — and their audience is 71% US against the first creator's 22%. The number that looked bad was the wrong number.
There's a fourth explanation people miss: the rate is dragged down by ghost and inactive followers, who inflate the denominator without being fraud. That's a pricing conversation, not a walk-away — the bot vs ghost vs inactive breakdown covers which is which.
Three Common Misreads
- Treating a media kit rate as comparable. Creators quote by-reach. Recalculate from public data first.
- Averaging across an account's whole history. Use the last 9 to 12 posts. Older content sat on a different algorithm.
- Reading high engagement as automatically clean. Pods produce real comments from real accounts. High rate plus 60%+ duplicate comments is worse than a modest rate with varied ones.
That third one is where vetting usually stops too early. Rate tells you how much interaction exists. It tells you nothing about whether the interaction is genuine. For that you need comment-level data — see how to check for fake Instagram followers for the signal-by-signal method.
What to Do With This
Engagement rate is a filter, not a verdict. Run the by-followers calculation, compare within tier, normalize for format, then check whether the engagement itself looks genuine.
- One formula, consistently applied. Mixing them is the most common error in creator vetting.
- Tier and format together, never tier alone.
- A number inside benchmark still needs a comment-quality check before you sign.
If you're evaluating more than a handful of creators, doing this by hand stops scaling fast. Run your candidate list in CreatiVault to get engagement, audience composition and comment quality side by side.
Frequently Asked Questions
What is a good engagement rate on Instagram in 2026?
It depends on tier. Roughly 3.5 to 6% for nano (1K to 10K), 1.5 to 3.5% for micro (10K to 100K), and 0.4 to 0.9% for macro and mega. Platform-wide average is now 0.48%, so tier context matters more than any single threshold.
How do I calculate real followers on Instagram?
You can't count them directly. Take average likes plus comments from the last 9 to 12 posts, divide by follower count, multiply by 100, then compare against the creator's tier. Audience-quality tools estimate a real-versus-suspicious split from engagement and comment patterns.
Does a low engagement rate always mean fake followers?
No. Format mix, posting frequency, vertical, and ghost followers all move the number legitimately. Investigate before concluding, especially for carousel-heavy or B2B accounts.
Is engagement rate by followers or by reach more reliable?
By followers, when vetting someone else's account, because it's the only one verifiable from public data. By reach is more accurate for your own post performance but inflates comparisons.

 Sophie Klein