Sep 22, 2026
Complete Influencer Vetting Checklist (6 Dimensions 2026)
6-dimension influencer vetting checklist: fake followers, engagement rate, audience match, content quality, brand fit, track record. Free Excel template.
 Sophie Klein3,242 words13 min read
A complete influencer vetting checklist covers 6 dimensions: fake follower detection (Step 1), engagement rate analysis, audience demographics match, content quality review, brand fit assessment, and past performance verification. Download our free Excel template to standardize vetting and avoid $15K+ campaign failures.
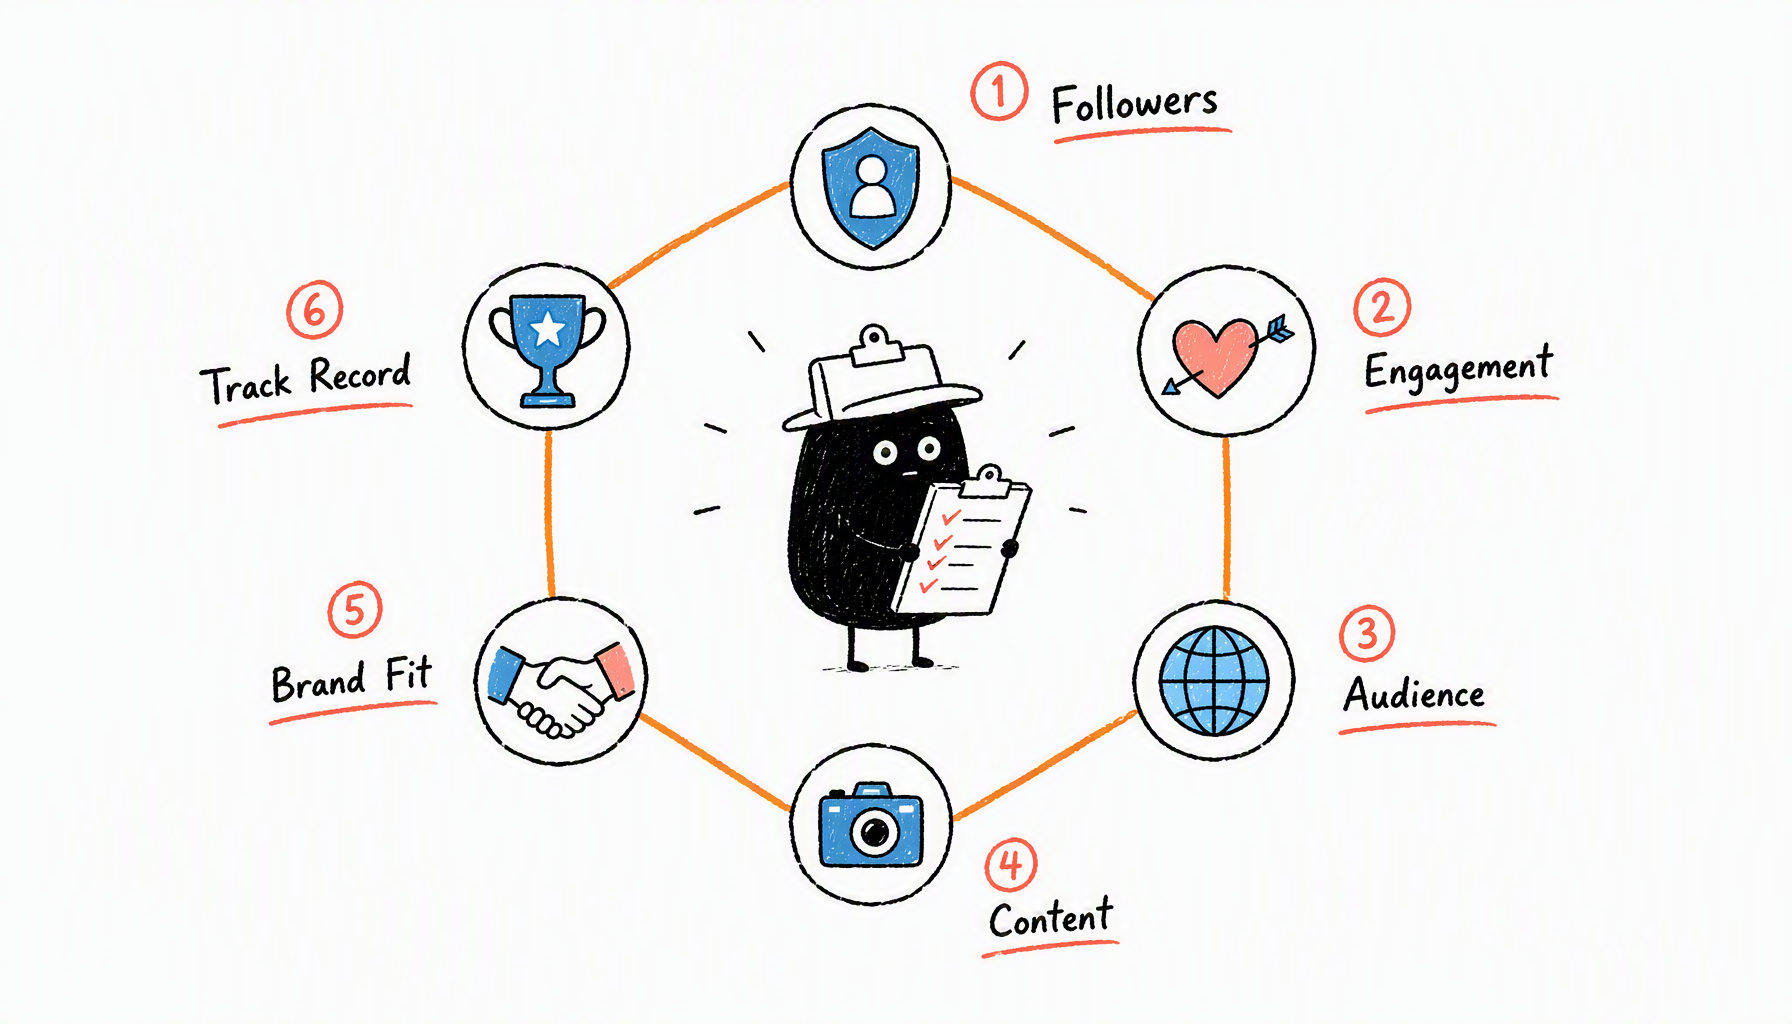
Sarah's brand paid $15,000 for an influencer campaign in March 2026. The creator had 500K followers and 8% engagement rate—looked perfect on paper. Three weeks later: 47 sales, $940 revenue, $314 cost per acquisition. Target was $40 CPA.
What went wrong? They ran a fake follower check (12% fake—acceptable). They calculated engagement rate (8%—strong for beauty category). But they skipped 4 critical dimensions.
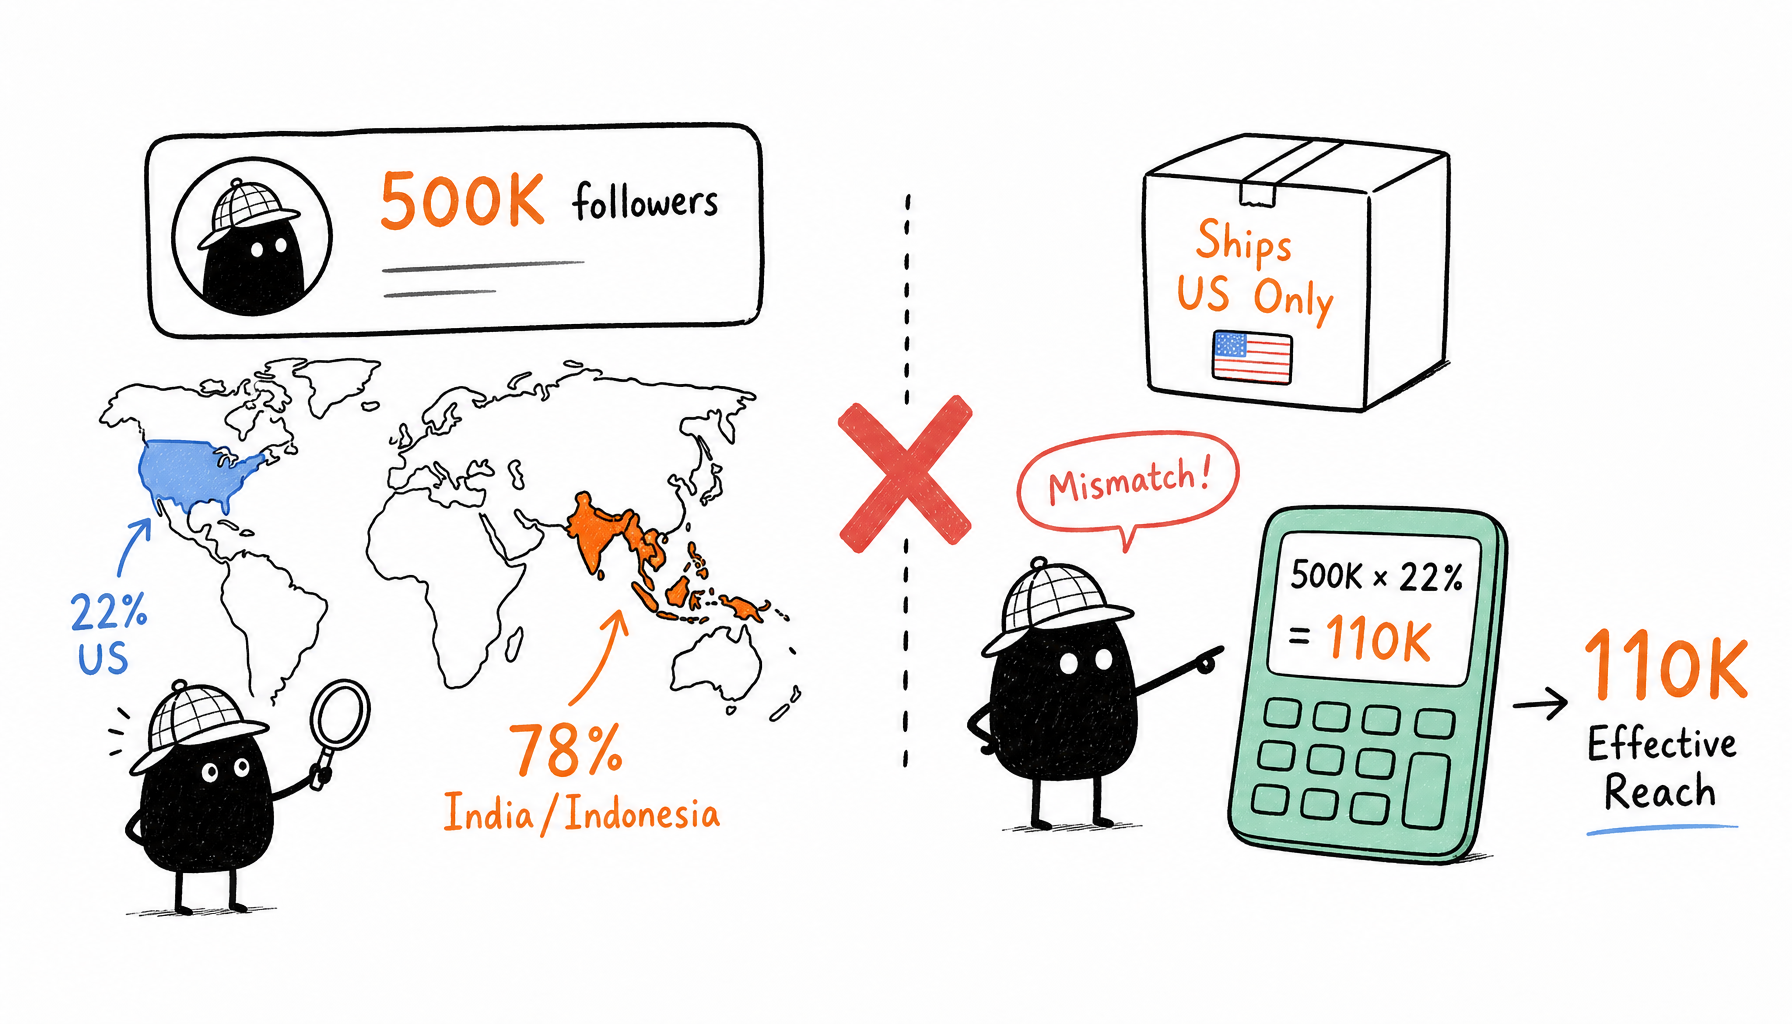
The real problem: 78% of the creator's followers were in India and Indonesia. The product only shipped to the US. Effective reach: 110K, not 500K.
This complete checklist catches problems like geographic mismatch before you sign contracts and wire payment. Here's the 6-dimension framework brands use to vet creators for deals over $1,000.
Key Takeaways
• Fake follower detection is Step 1 of 6—engagement rate, audience demographics, brand fit, content quality, and track record matter equally for campaign success
• Use red flag 🚩 (reject), yellow flag ⚠️ (investigate), green flag ✅ (approve) scoring to make objective vetting decisions instead of gut feelings
• Small deals (<$1K): 15-minute tool-only audit; mid-tier ($1K-$10K): 40-minute tool + manual audit; high-value (>$10K): 60-minute full 6-dimension audit
• Cross-border brands must verify follower geography matches target markets—80% US followers won't convert for UK or EU product launches
• Download the free Excel vetting template at the end to standardize your process across multiple creator candidates
Why Fake Follower Detection Isn't Enough
Most brands stop after running a fake follower check. That catches obvious frauds—creators who bought 300K bot followers from Fiverr. But it misses subtler problems that kill campaign ROI.
Sarah's $15K mistake (full breakdown):
Sarah's team vetted a beauty creator in February 2026:
- ✅ 500K Instagram followers
- ✅ 12% fake followers (under 15% threshold—acceptable)
- ✅ 8% engagement rate (strong for beauty niche)
- ✅ Production quality matched brand aesthetic
They signed a $15K 3-month ambassador deal for a US-only skincare product launch.
Campaign results (March-May 2026):
- 47 purchases
- $940 revenue
- $15,000 spent
- $314 cost per acquisition (10x over $30 target)
- Campaign ROI: -94%
Root cause analysis:
They audited Dimensions 1-2 (fake followers + engagement rate). They skipped Dimensions 3-6.
The missed red flag: Dimension 3 (Audience Match). 78% of followers were in India and Indonesia—countries where the brand doesn't ship. Only 22% (110K followers) were in the US target market.
Effective reach: 110K, not 500K. True CPM: $136, not $30. Geography mismatch made the campaign unviable before it started.
This 6-dimension checklist catches problems like this in a 60-minute audit.
The 6-Dimension Influencer Vetting Framework
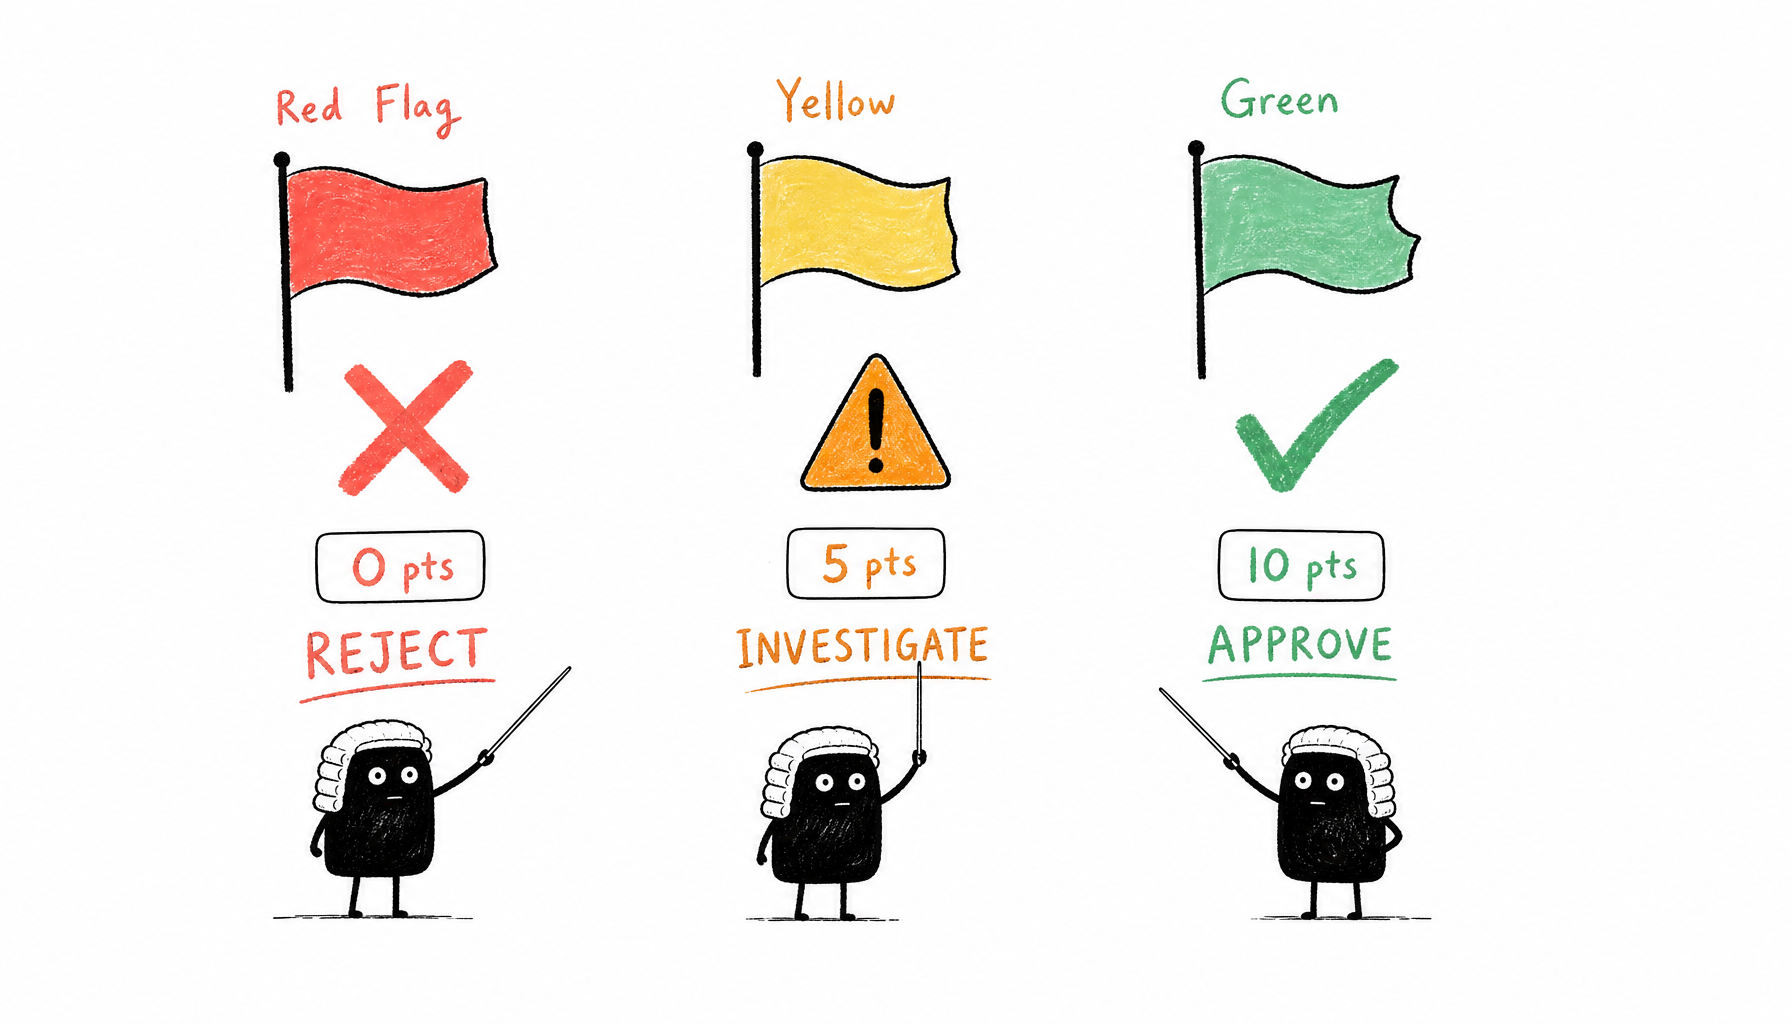
Overview: What Each Dimension Measures
Dimension | What it checks | Time required | Red flag threshold | When to check |
|---|---|---|---|---|
1. Follower Quality | Fake/bot percentage | 5 min (tool) | >25% fake | Every deal |
2. Engagement Rate | Real audience interaction | 10 min (manual calc) | <1% engagement | Every deal |
3. Audience Match | Demographics alignment | 10 min (screenshot) | <60% target market | Deals >$1K |
4. Content Quality | Production + style fit | 15 min (review posts) | Off-brand aesthetic | Deals >$2K |
5. Brand Fit | Values + past partners | 10 min (background check) | Competitor conflicts | Deals >$5K |
6. Track Record | Past campaign results | 10 min (request data) | No proof of ROI | Deals >$10K |
Audit time based on deal size:
- Quick screen (Dimensions 1-2): 15 minutes → Use for deals <$1K
- Standard audit (Dimensions 1-4): 40 minutes → Use for deals $1K-$10K
- Full audit (all 6 dimensions): 60 minutes → Use for deals >$10K
Dimension 1: Follower Quality (Fake Follower Detection)
What you're checking: Percentage of followers that are bots, inactive accounts, or mass-follow services.
Why it matters: Fake followers don't buy products. 30% fake followers means you're paying for 30% wasted reach.
Checklist
- [ ] Run creator's Instagram username through CreatiVault Instagram Fake Follower Checker
- [ ] Check fake follower percentage result
- [ ] If 15-25% fake: Manually click 20 random followers to verify quality
- [ ] Check follower growth chart for sudden spikes (bought followers)
- [ ] Compare fake % to category benchmark (varies by niche)
Category Benchmarks
Category | Normal Range | Red Flag |
|---|---|---|
Beauty/Fashion | 15-20% | >25% |
Tech/SaaS | 10-15% | >20% |
Food/Travel | 12-18% | >22% |
Fitness | 18-22% | >28% |
Fitness has higher baseline due to follow/unfollow tactics in the niche
Scoring
🚩 Red flags (Reject immediately):
- Over 30% fake followers
- Sudden follower spike (+50K in one day) with no viral post to explain it
- Follower geography doesn't match content language (English creator with 80% followers from random developing countries)
⚠️ Yellow flags (Investigate further):
- 20-25% fake followers (borderline; acceptable for some niches, risky for others)
- 15-20% fake + wrong geography (real accounts but not in target market)
- Gradual growth but engagement dropping (ghost followers)
✅ Green flags (Approve):
- Under 15% fake followers
- Steady organic growth pattern (no sudden spikes)
- Follower geography matches content language and target market
Time required: 5 minutes (tool) + 5 minutes (spot-check if borderline) = 10 minutes
Tools:
- CreatiVault Instagram Fake Follower Checker — 10 free checks/month, no credit card
- CreatiVault TikTok Fake Follower Checker — TikTok-specific detection
- Social Blade — Free follower growth chart (manual interpretation)
For deeper Instagram fake follower detection methods, see our Instagram fake follower checker tools guide. For TikTok-specific red flags, check our TikTok fake follower checker comparison.
Dimension 2: Engagement Rate
What you're checking: Are followers actually interacting with content, or are they passive/fake?
High follower count means nothing if those followers don't engage. A creator with 100K followers and 0.5% engagement rate has worse reach than a creator with 10K followers and 5% engagement rate.
How to Calculate
Formula:
Calculate for the last 12 posts (not just the top viral post—that skews high).
Manual Calculation Steps
- Open creator's Instagram profile
- Check their last 12 posts
- For each post: Record (Likes + Comments)
- Sum all engagement: Total ÷ 12 = Average engagement per post
- Average engagement ÷ Follower count × 100 = Engagement Rate %
Engagement Rate Benchmarks (2026)
Follower Count | Good | Average | Poor |
|---|---|---|---|
<10K | 6-10% | 3-5% | <3% |
10K-100K | 4-6% | 2-3% | <2% |
100K-500K | 3-5% | 1.5-2.5% | <1.5% |
500K-1M | 2-4% | 1-1.5% | <1% |
1M+ | 1.5-3% | 0.8-1.2% | <0.8% |
Larger accounts have lower engagement rates due to algorithm dilution
Scoring
🚩 Red flags:
- Engagement rate under 1% (regardless of follower count)
- High likes but zero comments (sign of bought likes, not real engagement)
- All comments are generic bots ("Nice!", "🔥🔥🔥", "Great post!") with no real conversations
⚠️ Yellow flags:
- Engagement rate at low end of "Average" benchmark
- Engagement used to be higher 6-12 months ago but dropped recently (check older posts)
- Engagement varies wildly post-to-post (10% on one post, 1% on next—inconsistent)
✅ Green flags:
- Engagement rate in "Good" range for follower tier
- Consistent engagement across last 12 posts (±20% variance acceptable)
- Comments are real conversations (followers ask questions, creator replies)
Time required: 10 minutes
Pro tip: Engagement rate alone doesn't prove followers are real. Combine Dimension 1 (fake follower %) + Dimension 2 (engagement rate) for full picture. A creator can have 90% real followers but 0.8% engagement if followers are disengaged. For deeper engagement rate analysis and benchmarks, see our Instagram engagement rate guide.
Dimension 3: Audience Match (Demographics & Geography)
What you're checking: Do the creator's followers match your target customer profile?
This is where Sarah's $15K campaign failed. The creator had real followers with real engagement—just not in the countries where the product shipped.
Case: Marcus avoids the same mistake
Marcus's DTC brand sells to the UK. He's vetting a UK beauty creator with 250K followers, 4% engagement rate, 14% fake followers (all green flags so far).
He asks for audience insights screenshot. Result: 68% followers in UK, 12% in US, 20% rest of world.
Marcus's calculation:
- Effective UK reach: 68% of 250K = 170K
- CPM calculation: $5,000 campaign budget ÷ 170K reach = $29 CPM (acceptable)
If he hadn't checked geography, he would've calculated $5K ÷ 250K = $20 CPM—understating true cost by 45%.
He approves the deal knowing the real reach number.
Checklist
- [ ] Follower age range matches your product's target age (70%+ overlap)
- [ ] Follower gender split matches your product (or product is gender-neutral)
- [ ] Follower geography: 60%+ in markets where you ship/serve
- [ ] Follower interests overlap with your product category
How to Check (3 Options)
Option 1: Request audience insights screenshot (fastest)
- Ask creator for screenshot of Instagram Insights → Audience tab
- Shows: Age range, gender %, top cities/countries, top interests
- Verify screenshot is recent (within 30 days)
- Time: 5 minutes (if creator provides quickly)
Option 2: Manual inference from comments (free but slow)
- Read 50 recent comments
- Note location mentions, language patterns, question topics
- Infer demographics from context
- Time: 20 minutes
Option 3: Audience analysis tool (most accurate, paid)
- HypeAuditor ($299/month): Full demographics breakdown
- CreatiVault Pro ($49/month): Geography distribution only
- Modash ($99/month): Demographics + interests
- Time: 2 minutes (if you have tool subscription)
Scoring
🚩 Red flags:
- Under 40% of followers in your target markets (paying for reach you can't convert)
- Follower age completely mismatched (you sell to 25-35, creator's audience is 13-17 teens)
- Follower interests have zero overlap with product category (tech creator for beauty product)
⚠️ Yellow flags:
- 40-60% follower match (borderline; acceptable for <$2K deals, risky for >$10K)
- Age range partially overlaps (your target 25-40, creator's audience 18-30)
- Some geographic spillover into adjacent markets you might expand to later
✅ Green flags:
- 70%+ followers in target markets
- Age/gender split closely matches your ideal customer profile
- Follower interests directly overlap with product category
Time required: 10 minutes (with screenshot), 20 minutes (manual inference)
Cross-border brands: This dimension is critical. A US creator with 80% followers in India won't convert for a US-only product. Always calculate effective reach = Total followers × % in target markets.
Dimension 4: Content Quality & Style Fit
What you're checking: Does the creator's production quality and aesthetic match your brand identity?
A creator can have perfect follower quality, engagement, and demographics—but if their content style feels off-brand, the sponsored post will flop.
Checklist
- [ ] Watch/review last 10 posts or Reels
- [ ] Production quality (lighting, editing, camera quality) matches your brand tier
- [ ] Content style (aspirational vs relatable, polished vs raw) aligns with brand tone
- [ ] Past sponsored posts feel authentic (not forced product placement)
- [ ] Creator's aesthetic matches your brand's visual identity
Scoring
🚩 Red flags:
- Low production quality (blurry photos, poor lighting, shaky videos) for premium brands
- Creator's style completely misaligned (creator is edgy/provocative, brand is family-friendly)
- Past sponsored posts are cringeworthy (overly salesy captions, awkward product holds)
- Creator posts controversial content that could damage brand reputation
⚠️ Yellow flags:
- Production quality acceptable but not excellent
- Style slightly off but could work with creative direction/brief
- Few past sponsored posts to assess (creator new to brand deals)
✅ Green flags:
- Production quality matches or exceeds brand's own content standards
- Creator's aesthetic naturally aligns with brand visual identity
- Past sponsored posts feel authentic and get engagement near organic post levels
- Creator's audience loves their content (positive comments, high saves/shares)
Time required: 15 minutes (watch 10 posts at 1.5x speed)
Pro tip: Show the creator's top 5 posts to your design or marketing team. If they say "this doesn't feel like our brand," trust them. Content mismatch kills authenticity, and audiences can tell when a partnership feels forced.
Dimension 5: Brand Fit & Values Alignment
What you're checking: Does the creator's values, past partnerships, and public image align with your brand?
Checklist
- [ ] Review creator's bio and pinned posts (what do they stand for?)
- [ ] Check past brand partnerships: Any competitors? Any controversial brands?
- [ ] Google search: `[Creator name] controversy` on Google and Twitter/X
- [ ] Verify no public statements that conflict with your brand values
- [ ] Check creator hasn't posted offensive/problematic content in past 12 months
Scoring
🚩 Red flags:
- Creator recently partnered with direct competitors (within past 6 months)
- Creator involved in public controversies or scandals
- Creator's stated values directly conflict with yours (e.g., anti-sustainability brand partnering with eco-focused creator)
- Creator promotes products/causes your audience would find offensive
⚠️ Yellow flags:
- Creator partnered with competitors 1-2 years ago (old enough maybe acceptable; verify exclusivity)
- Creator has mild past controversies unrelated to your niche
- Creator promotes neutral products/causes (not conflicting but not aligned)
✅ Green flags:
- Creator's values align with your brand mission
- No past partnerships with direct competitors
- No controversies or problematic posts in background check
- Creator's audience respects and trusts them
Time required: 10 minutes
For high-value deals (>$20K): Run background check through reputation monitoring service (Brandwatch, Mention, or similar). Legal teams often require this for contracts over $20K.
Dimension 6: Track Record & Proof of Results
What you're checking: Has the creator delivered results for past brand partners?
This dimension is hardest to verify (creators rarely share detailed performance metrics), but worth asking for high-value deals.
Checklist
- [ ] Ask creator for case studies or results from 2-3 past partnerships
- [ ] Request metrics if available: Clicks, conversions, sales (many won't share full data)
- [ ] Check if creator's past sponsored posts got engagement similar to organic posts
- [ ] For deals >$10K: Request references from 2-3 past brand partners
- [ ] Verify creator isn't overexposed (signing with everyone kills authenticity)
Scoring
🚩 Red flags:
- Creator refuses to provide any past results or references (for deals >$5K)
- Creator's sponsored posts get significantly lower engagement than organic (audience hates ads)
- Creator has 5+ active brand partnerships simultaneously (overexposure)
- Past brand partners give lukewarm or negative feedback
⚠️ Yellow flags:
- Creator new to brand partnerships (no track record yet)
- Creator provides some metrics but not enough to assess ROI
- Sponsored posts get slightly lower engagement (70-80% of organic is acceptable)
✅ Green flags:
- Creator provides case studies with metrics (CTR, conversions, even if incomplete)
- Past brand partners give positive feedback and would work with creator again
- Sponsored posts get engagement within 70-80% of organic post performance
- Creator is selective about partnerships (1-2 active deals max)
Time required: 10 minutes (if creator provides data upfront), 30 minutes (if you contact references)
For deals >$10K: Insist on references. If creator won't provide 2-3 past partner contacts, that's a yellow flag. Either negotiate lower price or pass.
Audit Scoring System: How to Make the Final Decision
After completing all 6 dimensions, score each one using this system:
Point Values
- 🚩 Red flag: 0 points
- ⚠️ Yellow flag: 5 points
- ✅ Green flag: 10 points
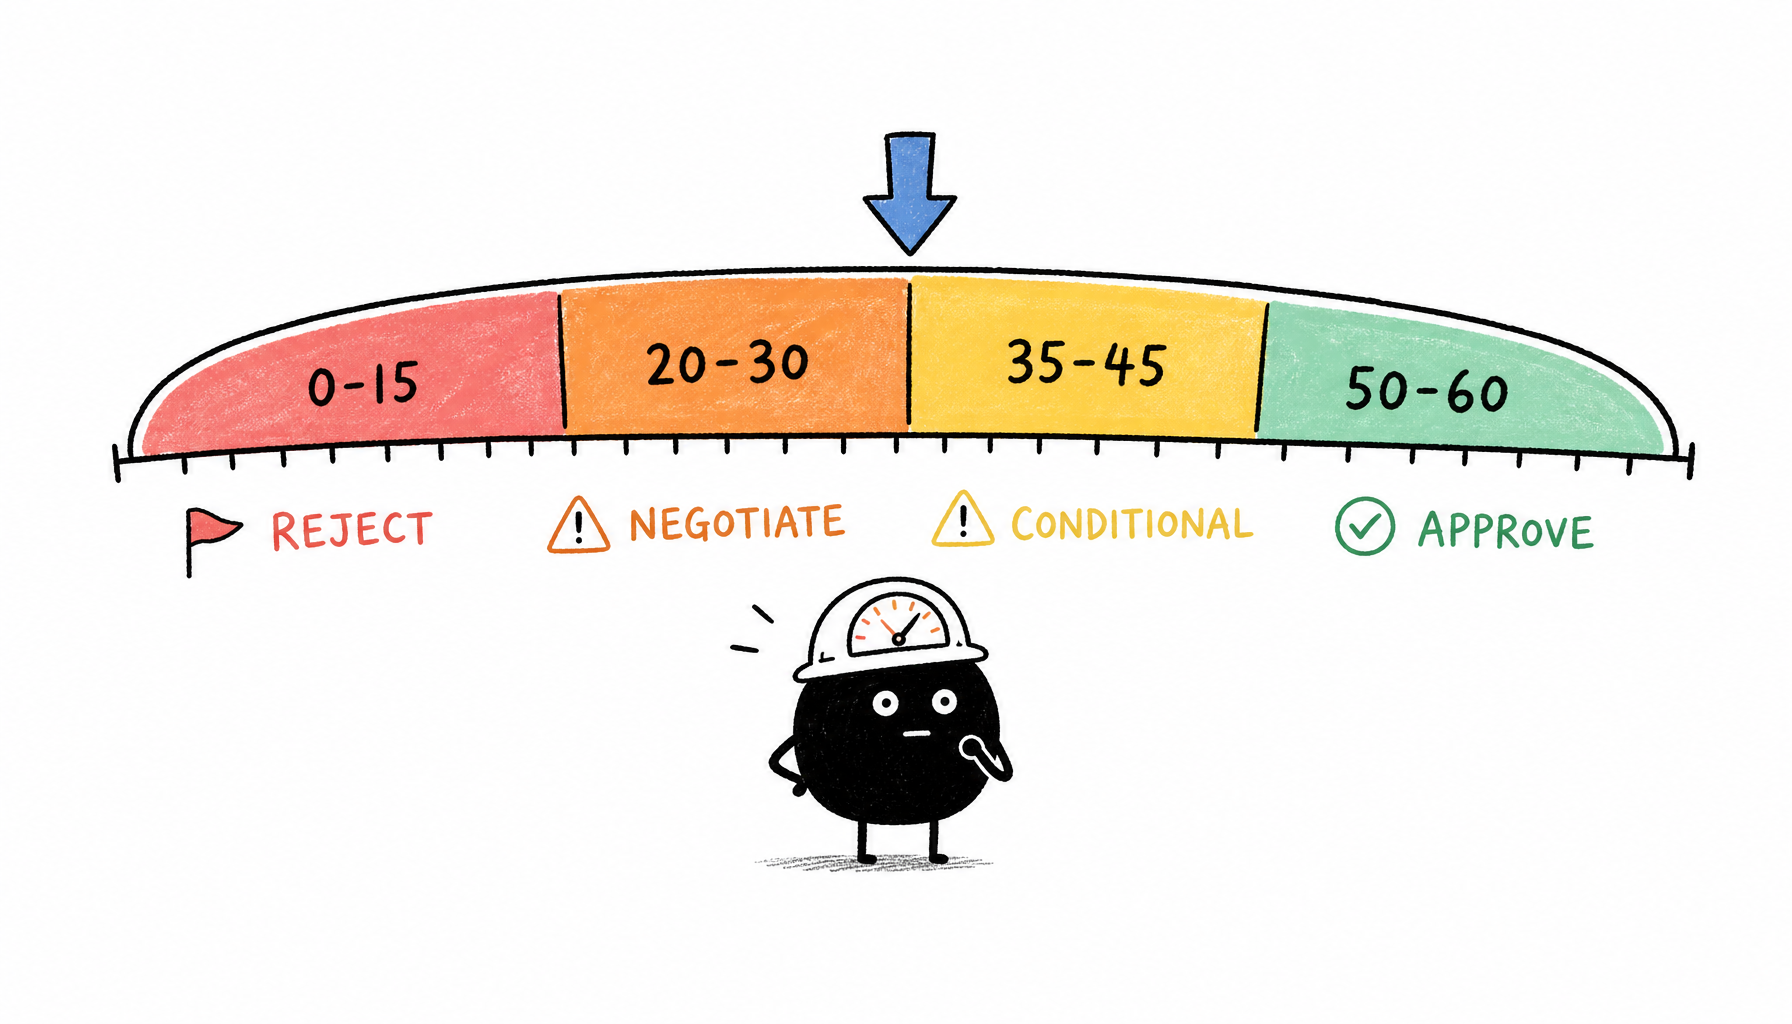
Total Score Thresholds
Total Score | Decision | Recommended Action |
|---|---|---|
50-60 | ✅ Approve | Green light for partnership. Proceed with contract. |
35-45 | ⚠️ Conditional Approve | Proceed with lower budget (cut 30-50%) or shorter test period (1 month vs 3 months). |
20-30 | ⚠️ Negotiate | Address specific yellow/red flags before signing. May need creative guardrails or performance clauses. |
0-15 | 🚩 Reject | Do not proceed. Too many red flags to salvage. |
Optional: Weight Adjustments for High-Value Deals
For deals over $10K, weight certain dimensions more heavily:
Dimension | Standard Weight | High-Value Weight (>$10K) |
|---|---|---|
1. Follower Quality | 1x (10 pts max) | 1.5x (15 pts max) |
2. Engagement Rate | 1x | 1.5x |
3. Audience Match | 1x | 2x (20 pts max) |
4. Content Quality | 1x | 1x |
5. Brand Fit | 1x | 1.5x |
6. Track Record | 1x | 2x |
Example weighted calculation:
- Dimension 3 (Audience Match): Green flag = 10 base points × 2 weight = 20 points
- New threshold for approval: 70+ points (instead of 50+)
Download: Free Influencer Vetting Template (Excel)
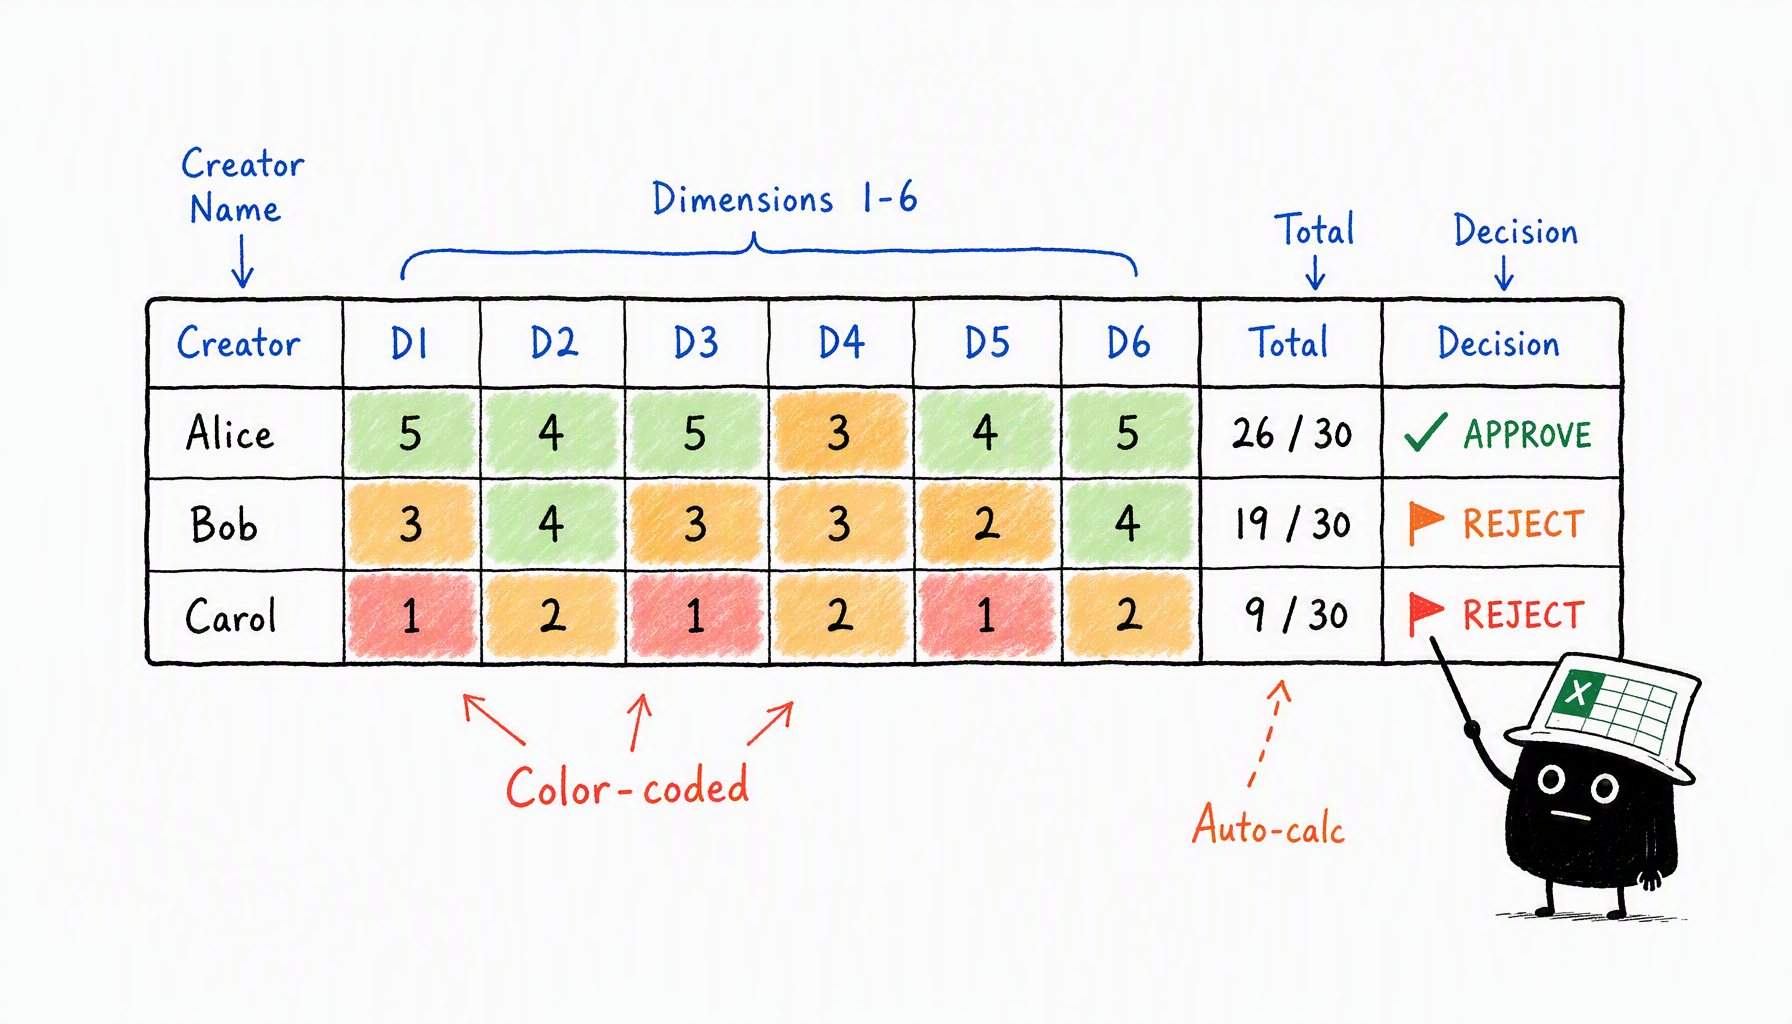
We've turned this 6-dimension checklist into a free Excel template you can download and reuse.
What's included:
- All 6 dimensions with sub-checklist rows
- Auto-calculated scoring (red/yellow/green → 0/5/10 points)
- Total score calculator with approval thresholds
- Notes column for each dimension
- Side-by-side comparison view (audit 5 creators in one sheet)
How to use it:
- Download the template
- Fill in one column per creator candidate
- Checkboxes auto-calculate red/yellow/green flags
- Total score at bottom shows approve/reject decision
- Compare multiple creators side-by-side to pick best fit
Download Free Excel Vetting Template → (Link placeholder—template to be hosted)
When to Use Full Checklist vs Quick Audit
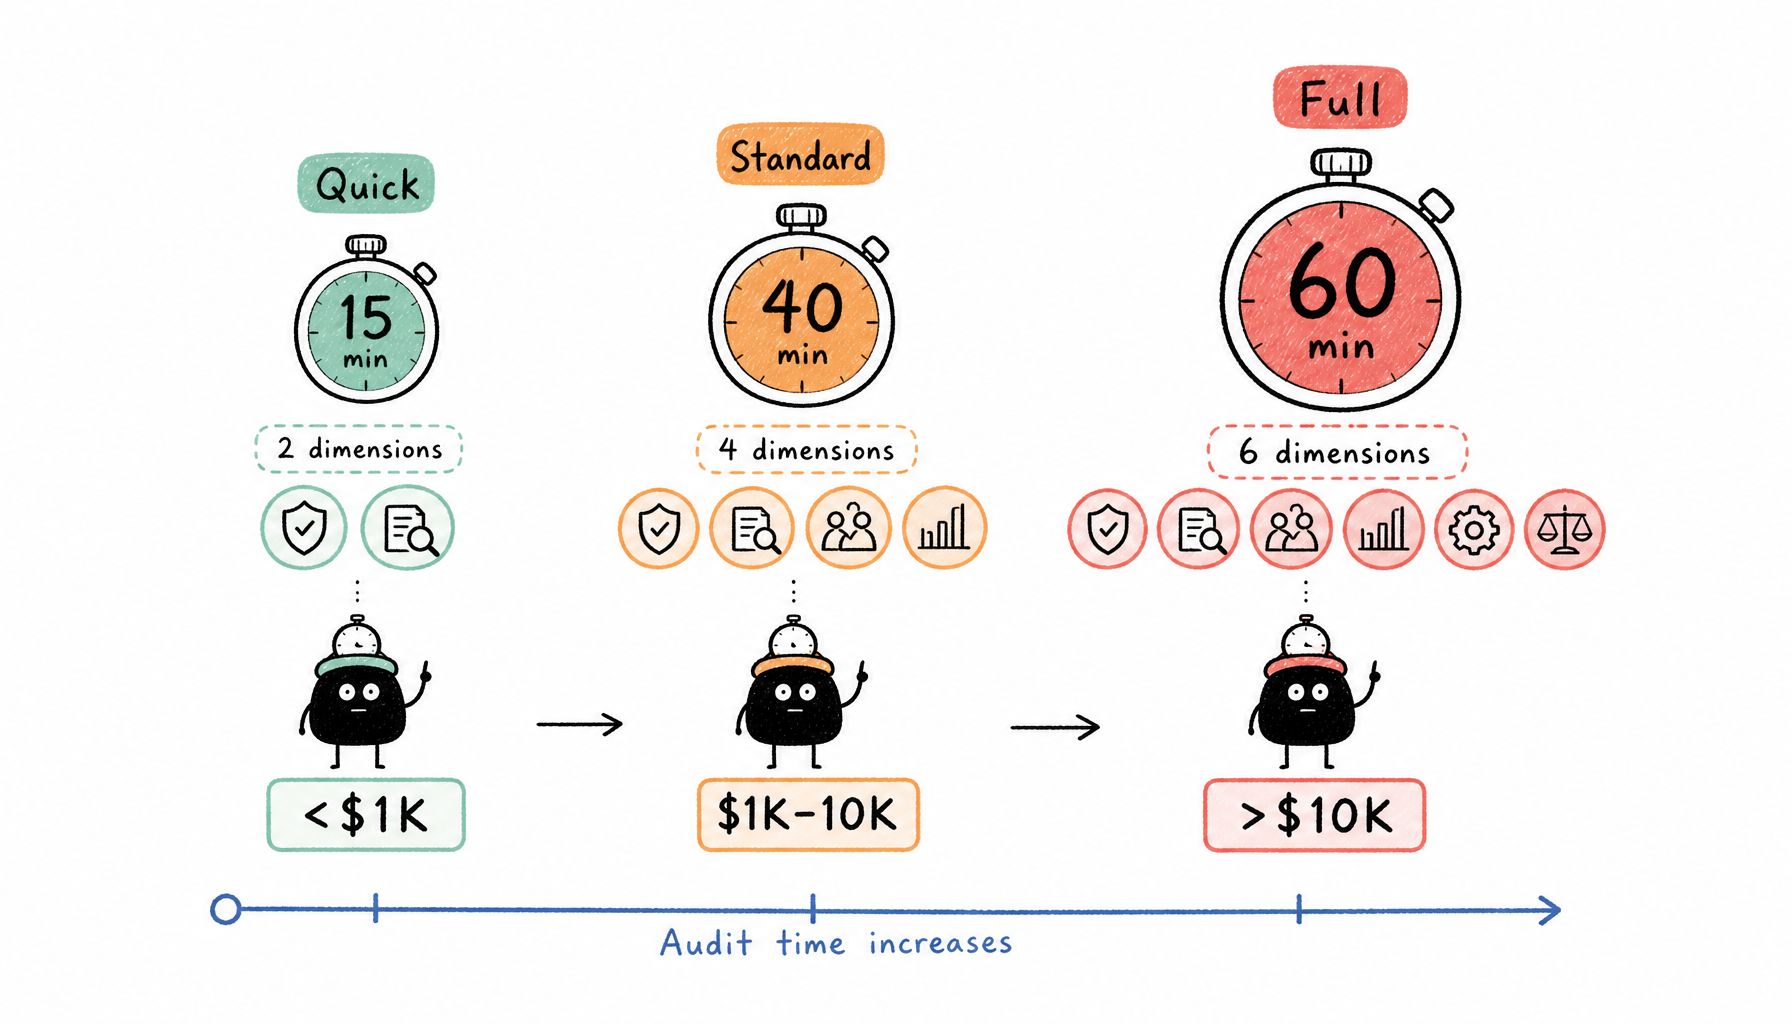
Not every partnership needs a 60-minute full audit. Match audit depth to deal size:
Quick Audit (Dimensions 1-2 Only) — 15 Minutes
Use for:
- Deals under $1,000
- Micro-influencers (10K-50K followers)
- Gifted product collaborations (no cash payment)
What to check:
- Dimension 1: Fake follower percentage
- Dimension 2: Engagement rate
Decision rule: Both pass = approve. Either fails = reject. No need to check other dimensions for small deals.
Standard Audit (Dimensions 1-4) — 40 Minutes
Use for:
- Deals $1,000-$10,000
- Mid-tier influencers (50K-500K followers)
- Campaigns with measurable ROI targets
What to check:
- Dimensions 1-2: Fake followers + engagement
- Dimension 3: Audience demographics match
- Dimension 4: Content quality fit
Decision rule: Need 3 out of 4 green flags to approve (30+ points).
Full Audit (All 6 Dimensions) — 60 Minutes
Use for:
- Deals over $10,000
- Long-term ambassador contracts (3-12 months)
- High-profile influencers (500K+ followers)
- Campaigns where brand reputation is at stake
What to check: Everything.
Decision rule: Need 45+ total points (weighted scoring for high-value deals). Must have zero red flags in Dimensions 3, 5, or 6.
Real Example: Full 6-Dimension Audit
Brand: DTC skincare startup (clean beauty, ships US-only)
Deal size: $8,000 for 3-month ambassador contract
Creator: 180K followers, beauty/skincare niche
Audit Results
Dimension | Finding | Flag | Base Points | Weighted |
|---|---|---|---|---|
1. Follower Quality | 18% fake (borderline) | ⚠️ Yellow | 5 | 7.5 (1.5x) |
2. Engagement Rate | 3.2% (good for 180K) | ✅ Green | 10 | 15 (1.5x) |
3. Audience Match | 72% US followers | ✅ Green | 10 | 20 (2x) |
4. Content Quality | High production, brand-aligned | ✅ Green | 10 | 10 (1x) |
5. Brand Fit | Past partnerships with complementary brands (no competitors) | ✅ Green | 10 | 15 (1.5x) |
6. Track Record | Provided case study: 4.2% CTR on past campaign | ✅ Green | 10 | 20 (2x) |
Total Score: 87.5 / 100 (weighted for $8K deal)
Decision: ✅ Approved
Outcome (June-August 2026):
- 312 sales
- $24,960 revenue
- $80 cost per acquisition (target was $100)
- Campaign ROI: +212%
- Success
The 18% fake followers (yellow flag) didn't sink the deal because all other dimensions were green, and the weighted score (87.5) was well above the 70-point threshold for high-value deals.
Conclusion: 60 Minutes Prevents $15K Losses
The difference between Sarah's $15K loss and this brand's $25K win was a 60-minute vetting audit.
Sarah skipped Dimension 3 (Audience Match). The creator's followers were real and engaged—just not in the countries where her product shipped. One missed dimension turned a promising partnership into a 94% loss.
This 6-dimension checklist catches those problems before you wire payment.
Your next steps:
- Download the free Excel vetting template to standardize your process
- Run Dimension 1 checks using CreatiVault's Instagram Fake Follower Checker (10 free checks/month, no credit card)
- Audit your next creator candidate using the appropriate depth:
- <$1K deals: Quick audit (15 min, Dimensions 1-2)
- $1K-$10K deals: Standard audit (40 min, Dimensions 1-4)
- >$10K deals: Full audit (60 min, all 6 dimensions)
- Score each dimension (red/yellow/green → 0/5/10 points)
- Compare total score to thresholds (50+ standard, 70+ high-value weighted)
One hour of vetting is cheaper than one failed campaign.
Ready to audit your next creator? Try CreatiVault's Instagram Fake Follower Checker — 10 free checks per month →
For TikTok creator vetting, see our TikTok Fake Follower Checker guide.