Sep 22, 2026
Instagram Engagement Rate: Calculate & Spot Fake (2026)
Calculate Instagram engagement rate (formula + benchmarks) and spot fake engagement. 5 red flags for bought likes/comments. Free checker tool.
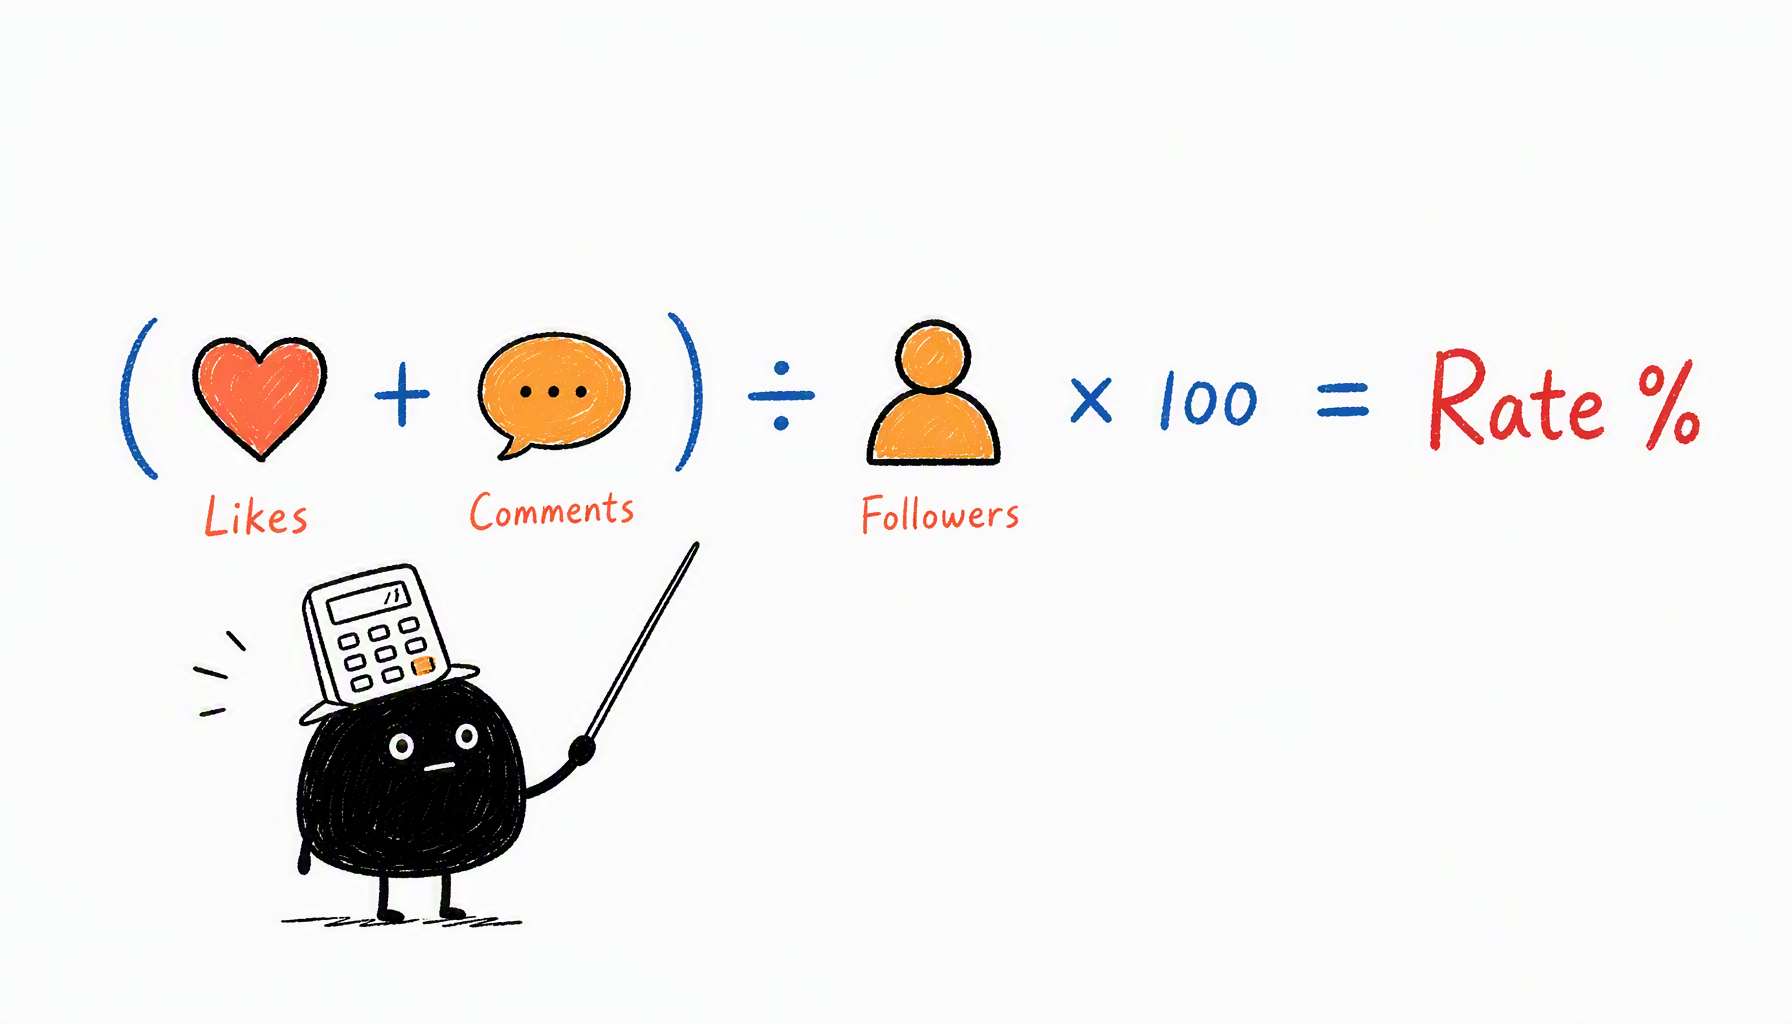
Instagram engagement rate = (Likes + Comments) ÷ Followers × 100. Calculate for the last 12 posts to get reliable average. 2026 benchmarks: <10K followers need 6-10%, 100K-500K need 3-5%, 1M+ healthy at 1.5-3%. High engagement doesn't prove followers are real—check for bot comments, likes-only posts, and sudden spikes.
Marcus found a creator with 12% engagement rate—triple the industry average. He was ready to sign a $10K deal. Then he clicked into the comments. Every single one was a bot: "Nice!", "🔥🔥🔥", "Great post!". His instinct saved him $10K. Here's how to calculate engagement rate AND spot when the numbers are fake.
Key Takeaways
• Calculate engagement rate as (Total Likes + Total Comments) ÷ Followers × 100 for the last 12 posts, not just one viral post
• 2026 benchmarks: <10K followers = 6-10% good; 100K-500K = 3-5% good; 1M+ = 1.5-3% healthy
• High engagement rate doesn't prove real engagement—red flags include generic bot comments, high likes with zero comments, and sudden engagement spikes
• Combine fake follower % with engagement rate: low fake % + high engagement = ideal; high fake % + high engagement = bought engagement
• Use CreatiVault Instagram Fake Follower Checker to verify follower quality before trusting engagement numbers
What Is Instagram Engagement Rate?
Definition: Engagement rate measures the percentage of followers who interact with content through likes, comments, shares, and saves.
Why it matters:
A creator with 100K followers and 1% engagement reaches fewer people than a creator with 10K followers and 5% engagement. Brands pay for engagement, not just follower count.
The basic formula:
Critical rule: Calculate for the last 12 posts, not just one. A single viral post skews high; a single flop skews low. 12 posts = reliable average.
How to Calculate Engagement Rate (Step-by-Step)
Step 1: Open the creator's Instagram profile
Step 2: Check the last 12 grid posts (skip Stories/Reels for now)
Step 3: For each post, record:
- Likes
- Comments
Step 4: Sum all engagement from 12 posts
Example:
Post # | Likes | Comments | Total |
|---|---|---|---|
1-12 | 48,000 | 960 | 48,960 |
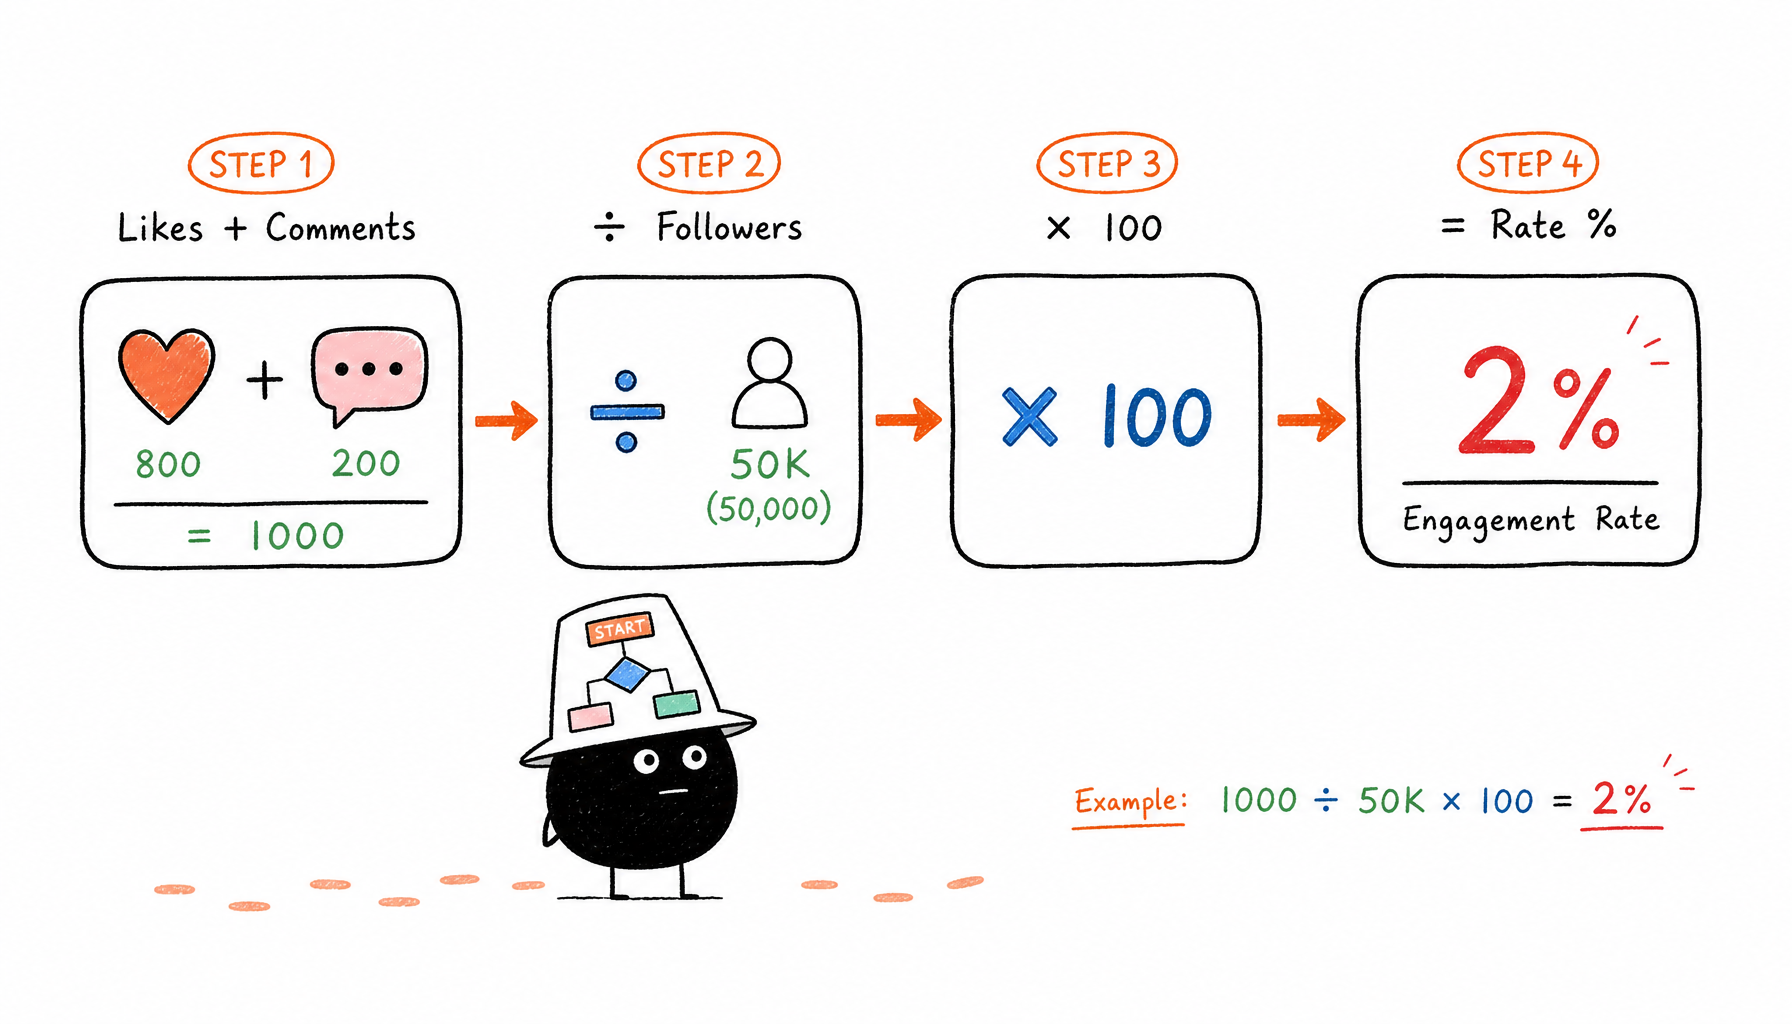
Step 5: Calculate average per post
48,960 ÷ 12 = 4,080 average engagement
Step 6: Divide by follower count
Creator has 120,000 followers:
4,080 ÷ 120,000 = 3.4% engagement rate
Result: 3.4% is "good" for 100K-500K followers (see benchmarks below).
Time required: 10 minutes
Instagram Engagement Rate Benchmarks (2026)
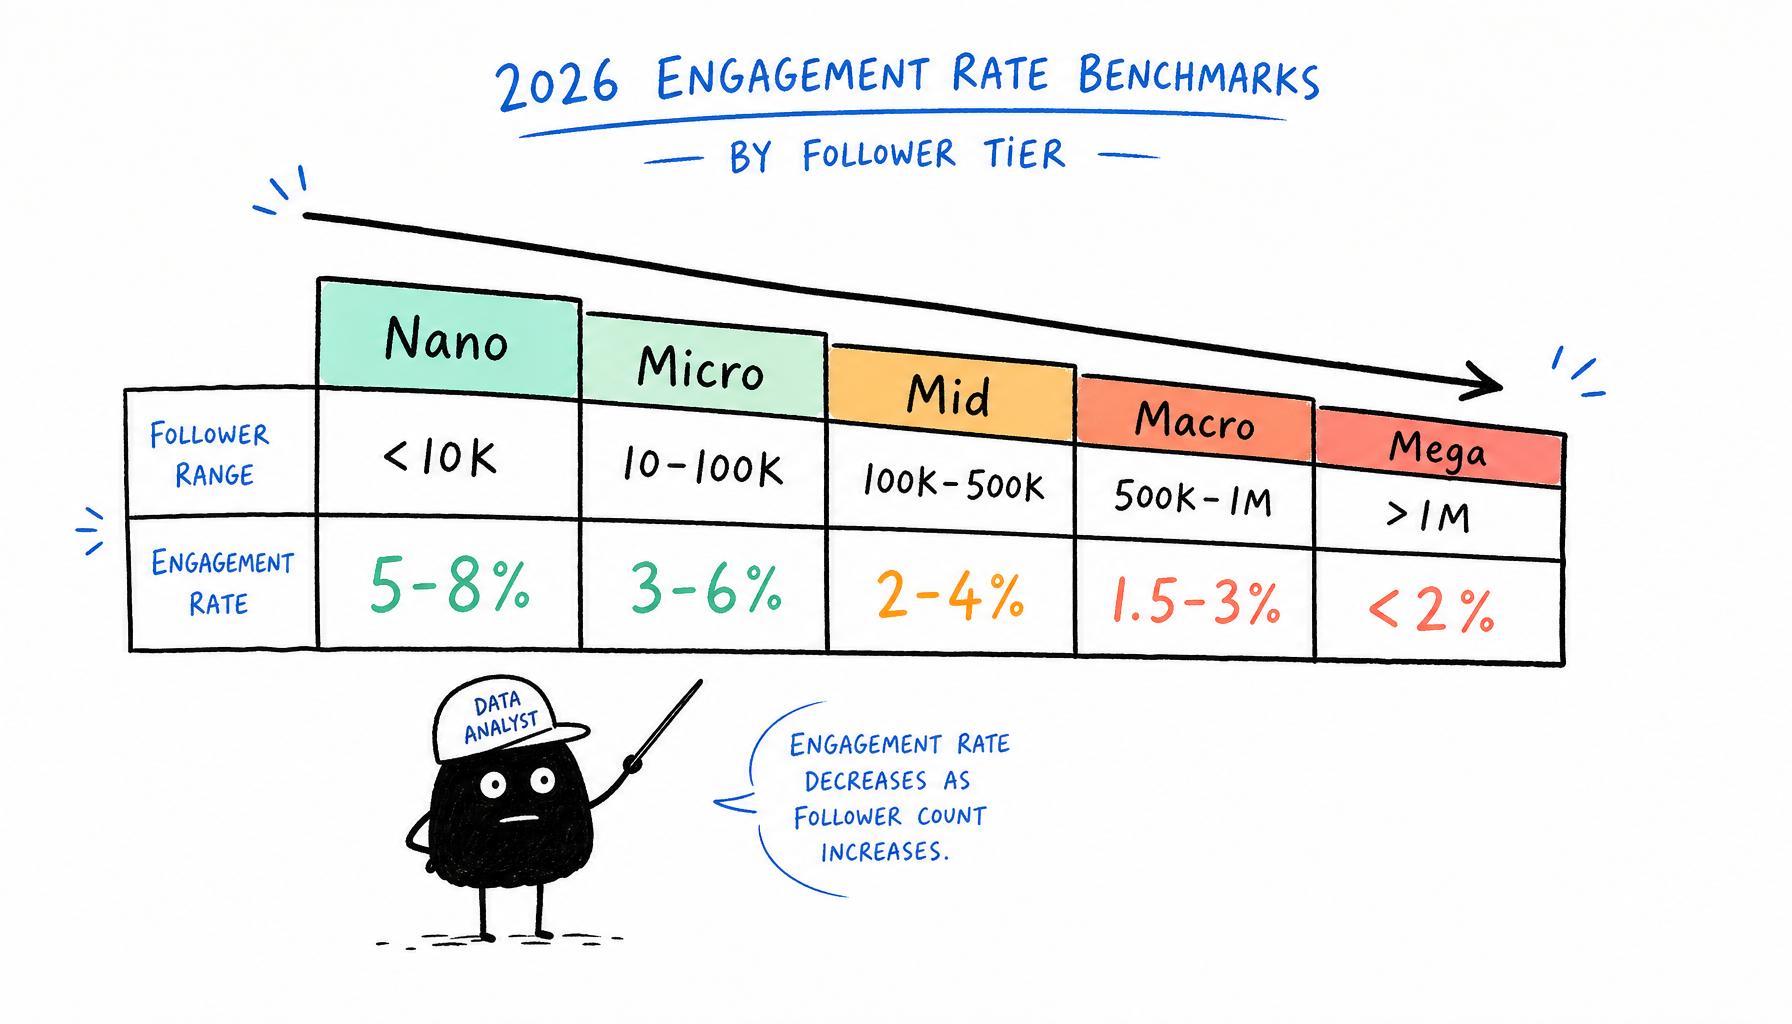
Follower Count | Good | Average | Poor |
|---|---|---|---|
<10K | 6-10% | 3-5% | <3% |
10K-100K | 4-6% | 2-3% | <2% |
100K-500K | 3-5% | 1.5-2.5% | <1.5% |
500K-1M | 2-4% | 1-1.5% | <1% |
1M+ | 1.5-3% | 0.8-1.2% | <0.8% |
Why engagement decreases as followers grow:
- Algorithm dilution: Instagram doesn't show posts to 100% of followers
- Broader audiences: Larger accounts have less engaged followers
- Ghost followers accumulate: Inactive accounts from past growth
2026 trend: Engagement rates dropped 15-20% since 2024 due to Reels competition and algorithm changes.
How to Spot Fake Engagement (5 Red Flags)
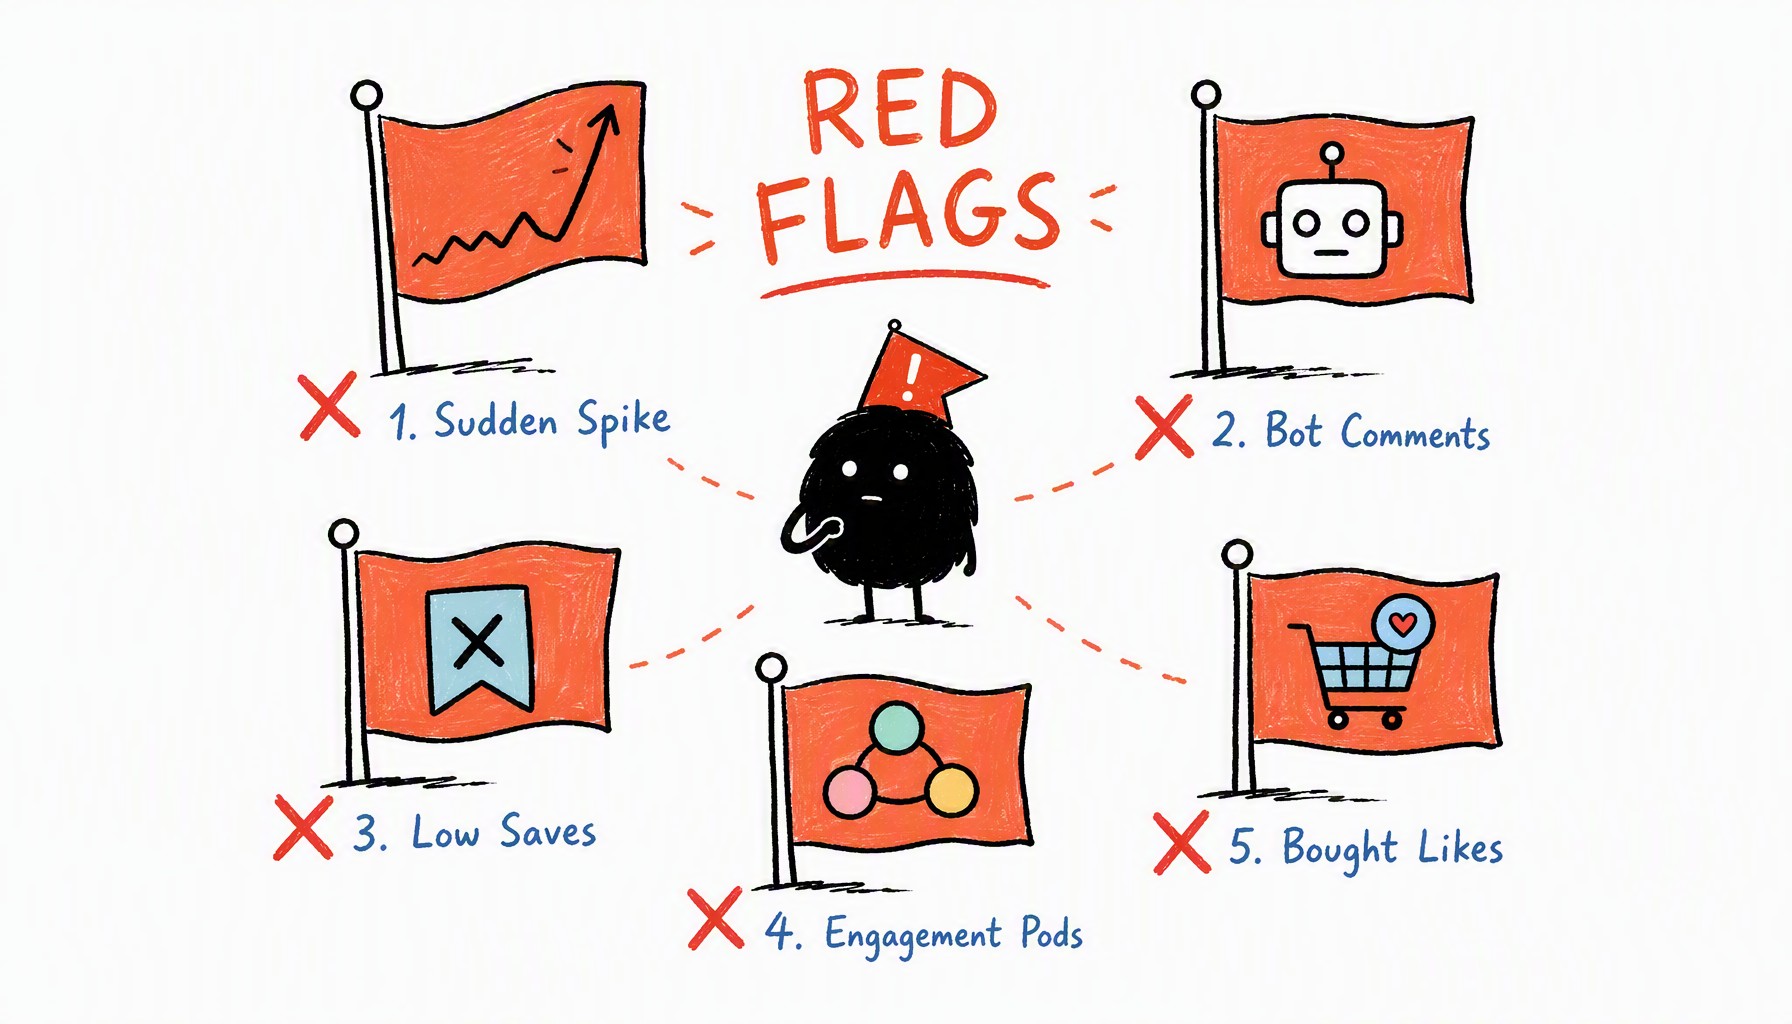
High engagement rate doesn't prove engagement is real. Here's how to spot bought likes and comments.
Red Flag #1: Generic Bot Comments
What to look for:
All comments are one-word reactions:
- "Nice!" / "Great!" / "Love this!"
- "🔥🔥🔥" / "❤️❤️❤️"
- Zero specific references to post content
Example: Post about skincare routine. Comments: "Nice!", "Cool!", "Amazing!"—no mention of products or skincare.
Green flag: Real comments reference the post: "What sunscreen?", "Trying this tomorrow", "Love the CeraVe rec!"
Red Flag #2: High Likes, Zero Comments
What to look for:
10,000 likes but only 5 comments = 2000:1 ratio (abnormal).
Normal ratio: 100:1 to 200:1 (Example: 5,000 likes, 25-50 comments)
Why this happens: Buying likes is cheaper than buying realistic comments.
How to check: Scroll 5-10 recent posts. If every post has 8K-12K likes but <10 comments = red flag.
Red Flag #3: Engagement Spike on Specific Posts
What to look for:
Most posts: 2,000-3,000 engagement
One post: 15,000 engagement (5x jump)
Check: Was there a viral reason? (Celebrity repost, trending audio, brand boost?)
If no clear trigger, the spike might be bought.
Red Flag #4: Same Commenters on Every Post
What to look for:
Same 5-10 accounts comment on every post with generic messages.
Why suspicious: Real followers don't comment on every post. Repeat bots are cheaper than unique bots per post.
Red Flag #5: High Engagement But High Fake Followers
The test:
Run CreatiVault Instagram Fake Follower Checker
Red flag scenario:
- 35% fake followers
- But 6% engagement rate (seems strong)
The contradiction: If 35% are fake, how is engagement 6%? Either:
- Real followers are hyper-engaged (rare)
- Engagement is also bought (likely)
Most likely: Bought engagement to match fake follower count.
Engagement Rate + Fake Follower Matrix
Combine both metrics for full picture:
Fake Follower % | Engagement Rate | Verdict |
|---|---|---|
<15% | 4-8% | ✅ Ideal — Real followers, real engagement |
<15% | 1-2% | ⚠️ Acceptable — Real but passive audience |
20-30% | 4-8% | 🚩 Red Flag — High engagement despite fake followers = suspicious |
>30% | Any % | 🚩 Reject — Too many fakes |
How to use:
- Run fake follower check
- Calculate engagement rate (last 12 posts)
- Plot on matrix above
- ✅ Top-left = approve. 🚩 Red flags = reject.
When Low Engagement Is Acceptable
Not every low rate is a red flag. Exceptions:
Exception #1: Mega-Influencers (1M+ followers)
Why: Algorithm dilution + broad audience = naturally lower %.
Example: 2M followers at 1.2% engagement = 24,000 engaged people per post—more than 50K creator at 5% (2,500 people).
Decision: For mega-influencers, focus on absolute reach (engagement × followers), not %.
Exception #2: Brand-Safe Content
Why: Educational or sensitive topics get lower engagement than entertainment.
Example: Mental health advocate posts therapy resources. Followers read but don't "like" sensitive topics. 1.5% engagement—but saves/shares are high.
Exception #3: Recent Viral Spike
Why: Creator gained 50K followers last month from viral post. New followers aren't fully engaged yet.
Check: Look at engagement before spike. If it was 5% before and 2% now, core audience is still strong—new followers diluted the %.
Should You Include Reels?
Short answer: Calculate separately.
Why: Reels reach non-followers through Explore. A Reel with 500K views might only convert 10K followers—skews engagement rate calculation.
Best practice:
- Feed ER: (Feed likes + comments) ÷ Followers
- Reels ER: (Reels likes + comments) ÷ Reels views (not followers)
Don't mix—they measure different things.
Tools to Automate Calculation
If vetting 10+ creators, automate:
Tool | Price | Best For |
|---|---|---|
HypeAuditor | $299/mo | Agencies, 50+ creators/month |
CreatiVault Pro | $49/mo | Small brands, 10-20 creators |
Modash | $99/mo | Mid-size brands |
Social Blade | Free | Budget option (manual) |
Free option: CreatiVault Checker for fake %, calculate ER manually (10 min).
Real Example: Fake Engagement Caught
Elena's audit:
Creator stats:
- 250K followers
- 8% engagement rate (strong for size)
- Posts look professional
Elena's check:
- Calculated ER: 8% ✅
- Ran fake follower check: 28% fake 🚩
- Clicked 10 random commenters: 8 were bots 🚩
Red flag matrix: 28% fake + 8% engagement = bought engagement
Elena rejected the deal. She later found out the creator bought followers AND engagement to look legitimate.
Saved: $12K campaign budget
Conclusion: Check Both Metrics
Marcus's instinct saved him $10K. He calculated 12% engagement—looked amazing. Then he read the comments: all bots.
The lesson: Engagement rate shows how much interaction. It doesn't show if interaction is real.
Your action plan:
- Calculate engagement rate (last 12 posts, 10 min)
- Check for 5 red flags (bot comments, likes-only, spikes, repeat commenters, fake followers)
- Run fake follower check (CreatiVault tool)
- Plot on matrix (fake % + engagement rate)
- ✅ Top-left = ideal. 🚩 Red flags = reject.
For deeper bot detection patterns, see our Instagram bot followers guide. For Instagram-specific fake follower checker tools, check our tool comparison guide. For complete influencer vetting beyond engagement metrics, use our influencer vetting checklist.
High engagement + low fake followers = ideal partnership.
High engagement + high fake followers = bought engagement. Walk away.
Ready to check real engagement? Run free fake follower check →
For TikTok creators: TikTok Fake Follower Checker
For complete vetting: Influencer Vetting Checklist
Word Count: 1,620 words

 Sophie Klein