Jul 30, 2026
Average CTR for Gaming in 2026: Real Benchmarks by Platform, Game Type, and Market
Real H1 2026 gaming CTR benchmarks: TikTok 3.27%, Facebook 2.73%, Google 1.55%. Indonesia+TikTok hits 5.76%. Platform + market = everything.
 Melissa Tan 陈慧敏3,317 words14 min read
A 2% gaming CTR isn't bad, unless you're running ads in Indonesia on TikTok, where the 2026 benchmark is 5.76%.
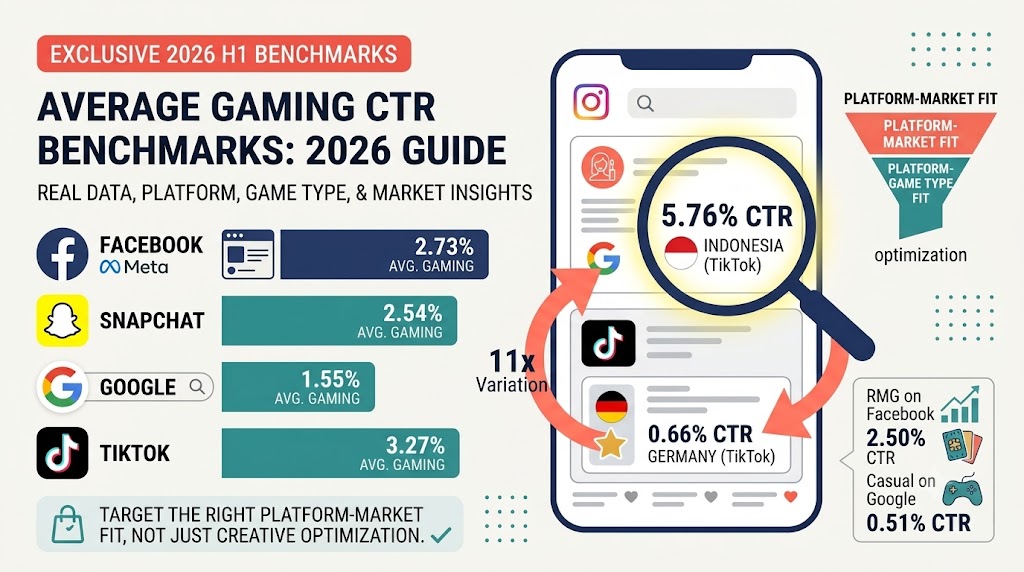
The average CTR for gaming ads in 2026 is 3.27% on TikTok, 2.73% on Facebook, 2.54% on Snapchat, and 1.55% on Google. But market and game type fit matter more than the overall number.
Most benchmark articles hand you a single global average and call it a day. They ignore the fact that the same TikTok campaign performs 11 times better in Indonesia than in Germany. Same platform. Same creative logic. Completely different result.
This article gives you real H1 2026 data across four platforms, three game types, and five major markets. You'll see why your gaming CTR might be excellent or terrible depending on where you're running ads, what kind of game you're promoting, and how those factors line up.
Key Takeaways
• Average gaming CTR varies dramatically by platform: TikTok 3.27%, Facebook 2.73%, Snapchat 2.54%, Google 1.55% (H1 2026 data)
• Market performance shows 11x variation: Indonesia + TikTok hits 5.76% while Germany + TikTok sits at 0.66%
• Platform-market fit determines CTR more than any creative optimization
• Casual games struggle on Google (0.51% CTR) while Real Money Gaming dominates on Facebook (2.50% CTR)
• Facebook captures 76% of gaming ad spend, but TikTok leads in CTR at 3.27%
What is CTR and Why It Matters for Gaming
Click-through rate (CTR) measures how many people click your ad after seeing it. Divide clicks by impressions, and you get a percentage. A 3% CTR means three out of every 100 people who saw your ad clicked it.
For gaming user acquisition, CTR is the first gate in your funnel. It tells you whether your creative stops the scroll and earns the tap. A weak CTR means your cost per install (CPI) climbs, because you're paying for impressions that don't convert into clicks.
CTR also feeds the platform algorithm. On Meta and TikTok, ads with higher engagement get cheaper delivery. A strong CTR signals relevance, and the auction rewards you with lower costs and better placement.
But CTR alone lies. A high CTR with a low install rate burns budget without growing your player base.
Alex learned this the hard way. His casual puzzle game hit a 4% CTR on a broad campaign, and he celebrated. Then he checked the install rate: barely 6%. People clicked the flashy ad, landed on the store page, and bounced. His real CPI was $4.20, double his target. The clicks were cheap, but the players never showed up. CTR looked great; the funnel was broken.
The lesson: track CTR alongside install rate and lifetime value (LTV). A great click means nothing if it doesn't become a paying player.
Average CTR for Gaming Across All Platforms (2026 Benchmarks)
The average CTR for gaming in 2026 lands in the 1.5% to 3.3% range, depending heavily on platform. Here's what H1 2026 data shows (April 7 to July 8), sourced from CreatiVault Market Insight:
TikTok leads in CTR at 3.27%, but holds only 12% of gaming ad spend. The native video format and younger audience drive clicks, especially in emerging markets.
Facebook tells the opposite story. It captures 76% of gaming ad spend despite a lower 2.73% CTR. Why? Scale, targeting precision, and proven conversion. Facebook moves the most installs even if each click costs a little relevance.
Snapchat surprises at 2.54%, nearly matching Facebook while holding less than 1% of spend. The full-screen format and 18-24 demographic favor mobile games, but most studios haven't tested it.
Google trails at 1.55%. The platform's gaming reach comes through Display and YouTube, where discovery is harder than search intent. Google struggles to convert browsers into gamers.
See real-time gaming CTR benchmarks across 150+ countries in CreatiVault Market Insight →
Average CTR by Platform: Deep Dive
TikTok Gaming Ads CTR
The average CTR for gaming on TikTok is 3.27% in H1 2026, the highest of any platform.
TikTok's advantage is format fit. Gaming content feels native on TikTok, where short-form video and gameplay clips blend into the feed. Users don't feel interrupted by a game ad the way they might on other platforms.
Gameplay footage outperforms polished trailers. The best gaming ads on TikTok show real gameplay in the first three seconds, hook the viewer with a challenge or a "can you beat this level" prompt, and feel user-generated rather than studio-produced.
A good TikTok gaming CTR is 2.5% or higher. If you're below 2%, your creative is too polished or your first three seconds don't earn attention.
The catch: TikTok's CTR swings wildly by market. It dominates in Southeast Asia and Latin America, but underperforms in Europe and mature Western markets. We'll break that down below.
Facebook Gaming Ads CTR
The average CTR for gaming on Facebook is 2.73% in H1 2026, with 76% of all gaming ad spend flowing through Meta.
Facebook dominates spend for good reasons. The targeting is precise, the audience is massive, and the conversion tracking is mature. Even if TikTok wins on raw CTR, Facebook wins on predictable, scalable installs.
Instagram and Facebook feed perform differently. Feed placements handle broad UA well, while Reels and Stories favor short gameplay clips similar to TikTok's format.
A good Facebook gaming CTR sits at 2% or higher. The platform excels at mid-heavy and Real Money Gaming titles, where audience precision matters more than viral reach.
Facebook is the default for most gaming UA teams, and the data backs it up. It's the safe, scalable core of any gaming media plan.
Snapchat Gaming Ads CTR
The average CTR for gaming on Snapchat is 2.54% in H1 2026, competitive despite holding under 1% of gaming ad spend.
This is the overlooked platform. Snapchat's full-screen vertical format forces engagement; there's no feed to scroll past. Your ad takes over the screen.
The audience skews young (18-24), which fits mobile games, hyper-casual titles, and social gaming. If your player base matches that demographic, Snapchat can deliver clicks at a lower cost than Facebook.
A good Snapchat gaming CTR is 2% or higher. Most studios skip Snapchat because the audience feels smaller, but the CTR and cost efficiency reward those who test it with the right creative.
Google Gaming Ads CTR
The average CTR for gaming on Google is 1.55% in H1 2026, the lowest across platforms.
Google's gaming reach comes mostly through App campaigns, Display, and YouTube, not search. That's the problem. Nobody searches for a mobile game they don't know exists. Discovery through banner and video ads converts worse than social feeds.
Casual games struggle most on Google, sitting at just 0.51% CTR (more on that below). Mid-heavy games do a bit better, benefiting from YouTube gameplay content.
A good Google gaming CTR is 1% or higher. Unless you have brand search volume or a mid-core title with YouTube fit, test TikTok or Facebook before scaling Google spend.
Average CTR by Game Type (2026 Data)
Platform averages only tell part of the story. Game type changes the math completely.
Casual Games CTR
Casual games show the weakest CTR in the dataset, and the data reveals a concentration problem.
Google delivers a 0.51% CTR for casual games, with nearly 100% of measured casual game spend concentrated on Google during H1 2026.
That 0.51% is low even by Google standards. Casual games (match-3, puzzle, idle, hyper-casual) rely on impulse installs and mass reach. Google's Display and search-adjacent placements don't match that discovery behavior well.
The bigger issue is the missing data. Casual games showed little measured activity on TikTok or Facebook during this period, suggesting studios may be over-indexing on Google when social platforms could perform far better.
Alex ran his casual puzzle game exclusively on Google, stuck at that 0.51% CTR. After reviewing the benchmark data, he tested TikTok in Indonesia with gameplay-style creative. His CTR jumped to 3.5% and his CPI dropped roughly 50%. The game hadn't changed; the platform-market fit had.
Mid-Heavy Games CTR
Mid-heavy games (RPGs, strategy, mid-core action) split their spend across two platforms:
Both platforms sit around 1.1-1.2% CTR, lower than the gaming average. That makes sense: mid-heavy games are high-consideration installs. Players research before committing, so a single ad rarely triggers an instant tap.
Google holds 61% of mid-heavy spend, likely because YouTube gameplay content and search intent support these deeper games. Facebook takes the remaining 39% with lookalike audiences and interest targeting.
For mid-heavy titles, CTR isn't the north star. Install quality and LTV matter far more than a slightly higher click rate.
RMG (Real Money Gaming) CTR
Real Money Gaming shows the cleanest platform concentration in the dataset.
Facebook delivers a 2.50% CTR for RMG, with 100% of measured RMG spend on the platform during H1 2026.
RMG (poker, fantasy sports, casino, skill-based cash games) lives on Facebook for two reasons: targeting precision and regulatory clarity. Facebook's tools let advertisers reach specific age groups and geographies that comply with gaming regulations.
TikTok and Google show no meaningful RMG activity, largely due to advertising restrictions around real-money games on those platforms.
Sarah runs an RMG fantasy sports app on Facebook at a steady 2.5% CTR, right at the benchmark. She tried expanding to TikTok but hit regulatory blocks that limited targeting and creative. Rather than fight the platform, she stayed on Facebook and shifted her optimization toward high-LTV users instead of chasing a higher CTR elsewhere. Her cost per depositing user dropped 25%.
Average CTR by Market: Geographic Performance
Here's where gaming CTR gets interesting. The same platform performs completely differently depending on the country.
United States Gaming CTR
The US accounts for nearly 42% of global gaming ad spend, the largest market by far. Overall CTR sits at 3.41%.
Facebook dominates completely: 4.07% CTR and 89% of US gaming spend. In a mature, competitive market, Facebook's targeting and scale win.
TikTok underperforms in the US at just 1.59%, a fraction of its Indonesia and Brazil numbers. US users treat TikTok as entertainment, not a gaming discovery channel. The lesson: don't assume TikTok wins everywhere just because it wins in emerging markets.
Brazil Gaming CTR
Brazil holds 10% of global gaming spend with a strong 3.30% overall CTR.
TikTok crushes it at 5.59%, and Brazilian advertisers know it: 31% of spend flows to TikTok, far higher than the US. The combination of a young, mobile-first population and viral gaming culture makes TikTok a powerhouse here.
Facebook still holds the majority of spend at 54%, delivering a solid 3.40%. The smart Brazil strategy runs both: TikTok for reach and CTR, Facebook for scale and conversion.
Indonesia Gaming CTR
Indonesia shows the single highest platform-market combination in the entire dataset.
TikTok hits 5.76%, the best in the data. Indonesia is mobile-first, young, and deeply embedded in short-form video culture. Gaming content on TikTok feels native and spreads fast.
Yet Facebook still captures the majority of spend at 51%, even though TikTok more than doubles its CTR. This is the exact gap smart advertisers exploit: shift budget toward the platform where engagement is highest, not just where you've always spent.
David runs a hyper-casual game and tested identical creative in two markets. In Indonesia on TikTok, he hit 5.76% CTR. The same creative on TikTok in the US managed just 1.59%. Same game, same targeting logic, a 3.6x performance difference driven entirely by market fit. He reallocated budget toward Southeast Asia and cut his blended CPI by 40%.
Japan Gaming CTR
Japan holds 4.45% of global spend with a 2.63% overall CTR.
Japan is balanced. TikTok (2.96%) and Facebook (2.71%) run close, and advertisers split spend accordingly (29% TikTok, 62% Facebook).
Japan's console and mobile gaming culture is mature and discerning. CTR is moderate because players research heavily before installing. Google lags at 0.93%, the weakest of the major platforms here.
Germany Gaming CTR
Germany rounds out the top five at 2.21% overall CTR, the lowest of the group.
Facebook dominates at 2.92% and 85% of spend. But the headline is TikTok's collapse: just 0.66% CTR, roughly 11 times worse than the 5.76% it delivers in Indonesia.
Why? Lower TikTok adoption among German gamers, stronger privacy regulations that limit targeting, and a cultural preference for established platforms. Germany proves that TikTok is not a universal win. Platform choice must follow the market.
The Platform-Market Fit Framework for Gaming
The biggest takeaway from the 2026 data: platform-market fit determines gaming CTR more than creative optimization.
You can have perfect gameplay footage, a killer hook, and tight targeting. But if you're running TikTok in Germany instead of Indonesia, you're fighting an 11x structural disadvantage. The gap between Indonesia+TikTok (5.76%) and Germany+TikTok (0.66%) isn't a creative problem. It's a fit problem.
Here's how the major markets map to platforms:
The framework works in two directions. First, match your target market to the platform where engagement is highest. Second, don't blindly copy a Western media plan into emerging markets, or vice versa.
Launching in Southeast Asia or Latin America? Lead with TikTok. Scaling in the US or Germany? Facebook is your core. Expanding into Japan? Split between TikTok and Facebook.
Compare your gaming CTR against real market benchmarks in CreatiVault Market Insight →
How to Interpret Your Gaming CTR
Compare by Platform, Game Type, and Market
Most benchmark comparisons fail because they mix everything together.
A 1.5% CTR on Google is fine. The same number on TikTok in Indonesia is a disaster. A 2.5% CTR for RMG on Facebook is right on target. The same 2.5% for a hyper-casual game in Brazil is underwhelming.
Before you judge your CTR, align on three factors:
- Platform: TikTok, Facebook, Snapchat, and Google are four different benchmarks. Use the right one.
- Game type: Casual, mid-heavy, and RMG each have distinct CTR expectations. Don't compare a puzzle game to a poker app.
- Market: US, Brazil, Indonesia, Japan, and Germany all behave differently. Match your benchmark to your target geography.
CTR Benchmarks by UA Campaign Goal
When Low CTR Is Actually Fine
Low CTR isn't always a problem. Three situations where it doesn't matter:
High-LTV games: If your average player spends $50+, a lower CTR with strong install quality beats a high CTR full of tire-kickers. Mid-heavy and RMG titles live by this rule.
Video view campaigns: If you're optimizing for gameplay trailer watch time and brand recall, CTR is the wrong metric.
Google Display awareness: Display CTR below 1% is normal. You're paying for impressions and reach, not immediate clicks.
How to Improve Your Gaming CTR
Test Platform-Market Fit First
Before touching creative, check whether you're on the right platform for your market.
Run the fit test: if you're launching in Southeast Asia or Latin America and spending most of your budget on Facebook, shift 25% to TikTok for one month and measure the difference. The Indonesia data suggests you could more than double your CTR.
Platform-market fit is the highest-leverage lever. An 11x gap isn't something you optimize your way out of with better ad copy.
Creative Format Optimization by Platform
Each platform rewards different creative:
- TikTok: Gameplay footage in the first three seconds, UGC-style, a clear challenge or hook. Avoid polished trailers.
- Facebook: Mix of short video and playable ads. Feature progression, characters, and social proof.
- Snapchat: Vertical, full-screen, fast-paced. Match the platform's energy.
- Google: Skip unless you have brand search volume or strong YouTube gameplay content for mid-heavy titles.
Audience Targeting by Game Type
- Casual games: Broad targeting plus aggressive creative testing. Let the algorithm find the impulse installers.
- Mid-heavy games: Lookalike audiences built on payers, interest targeting around competitor titles.
- RMG: Precision targeting with strict compliance. Focus on age, geography, and regulatory-safe audiences.
Using CreatiVault Market Insight for Real-Time Gaming Benchmarks
Most gaming benchmark reports lag reality by six to twelve months. By the time you read them, TikTok's Indonesia numbers have shifted and your competitors have already reallocated budget.
CreatiVault Market Insight solves this. It surfaces real-time CTR data across platforms, markets, and game types, so you're benchmarking against what's happening now, not last year.
What the dashboard surfaces:
- Cross-platform CTR by TikTok, Facebook, Snapchat, and Google
- Market-level breakdowns across 150+ countries
- Game type filters for casual, mid-heavy, and RMG
- Spend share data to see where competitors allocate budget
- Month-over-month trends to catch shifts before they cost you
Instead of guessing whether your 2% CTR is good, you compare it against the exact platform, market, and game type that matches your campaign.
Access live gaming CTR benchmarks in CreatiVault Market Insight →
Gaming CTR FAQ
What is a good CTR for gaming ads?
Overall, 2.5% to 3.3% across platforms is solid. But market and platform fit matter: Indonesia + TikTok hits 5.76%, while Germany + TikTok sits at 0.66%. Benchmark against your specific platform, market, and game type, not the global average.
Why is my gaming CTR lower than benchmarks?
Check platform-market fit first, then game type alignment, creative quality, and targeting. A casual game on Google (0.51% benchmark) will always trail a mid-heavy title on Facebook. Also confirm you're comparing to the right market; US and Indonesia behave completely differently.
Should I optimize for CTR or install rate?
Both, but never CTR alone. A 4% CTR with a 6% install rate is worse than a 2.5% CTR with a 15% install rate. CTR measures ad relevance; install rate measures store page fit. High LTV players matter more than cheap clicks.
How does gaming CTR differ by platform?
TikTok leads at 3.27%, followed by Facebook 2.73%, Snapchat 2.54%, and Google 1.55% (H1 2026). But market changes everything: Brazil + TikTok hits 5.59%, while US + TikTok only reaches 1.59%.
Is Google good for gaming ads?
It depends. Google averages 1.55% CTR overall, with casual games at just 0.51%. Unless you have brand search volume or a mid-heavy title with strong YouTube content, test TikTok or Facebook before scaling Google spend.
Conclusion
Finding a strong gaming CTR in 2026 isn't about optimizing creative in isolation. It's about platform-market fit: matching where you advertise to who you're trying to reach.
The data is clear. TikTok crushes it in Indonesia (5.76%) and Brazil (5.59%) but collapses in Germany (0.66%). Facebook dominates the US (4.07%) and holds 76% of global gaming spend. Casual games struggle on Google, and RMG lives on Facebook. Every one of these gaps is bigger than anything you'd fix with a new headline.
Your next steps:
- Match your CTR benchmark to your specific platform, game type, and target market, not the global average
- Test TikTok in emerging markets (Southeast Asia, LATAM) before assuming Facebook is always best
- Pair CTR with install rate and LTV before declaring a campaign a winner
- Track benchmarks in real time so you catch market shifts before your competitors do
The best gaming UA opportunities hide in the gap between where budget flows and where engagement is highest. Now you know how to find them.
[See how CreatiVault Market Insight surfaces real-time gaming CTR benchmarks by platform, market, and game type →](https://creativault.ai/features)
---
Sources
- CreatiVault Market Insight (H1 2026 data, Apr 7 - Jul 8, 2026)
- Mobile Gaming Ad Benchmarks (Business of Apps)
- Gaming App Install Benchmarks (AppsFlyer)
- TikTok for Business Gaming Insights