Jul 30, 2026
Average CTR for Ecommerce in 2026: Real Benchmarks by Platform and Category
Real H1 2026 ecommerce CTR benchmarks: Facebook 3.30%, Google 2.38%, TikTok 2.17%. Beauty hits 19.39% on Google. Platform + category = everything.
 Melissa Tan 陈慧敏3,511 words15 min read
A 2% CTR isn't bad — unless you're running Beauty ads on Google, where the 2026 benchmark is 19.39%.
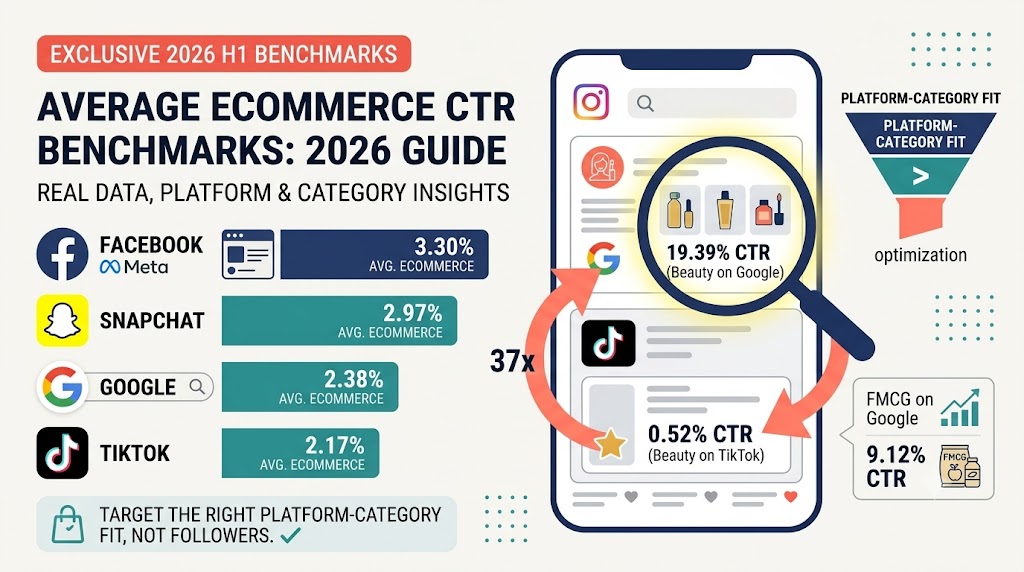
The average CTR for ecommerce in 2026 is 3.30% on Facebook, 2.97% on Snapchat, 2.38% on Google, and 2.17% on TikTok — but category and platform fit matter more than the overall number.
Most benchmark articles hand you outdated 2024-2025 data and call it a day. They ignore the fact that a Beauty brand on Google performs 37 times better than the same brand on TikTok. Same product. Same creative quality. Completely different result.
This article gives you real H1 2026 data across four platforms and multiple ecommerce categories. You'll see why your 2% CTR might be excellent or terrible depending on where you're running ads, what you're selling, and how those two factors fit together.
Key Takeaways
• Average ecommerce CTR varies dramatically by platform: Facebook 3.30%, Snapchat 2.97%, Google 2.38%, TikTok 2.17% (H1 2026 data)
• Category performance shows 37x variation: Beauty & Cosmetics hits 19.39% on Google but only 0.52% on TikTok
• Platform-category fit determines CTR more than any optimization tactic
• FMCG products dominate on Google with 9.12% CTR, nearly 4x the ecommerce average
• 78% of ecommerce ad spend goes to Facebook, but that doesn't mean it's the best platform for every category
What is CTR and Why It Matters for Ecommerce
Click-through rate (CTR) measures how many people click your ad after seeing it. The formula is simple: clicks divided by impressions, expressed as a percentage.
A 3% CTR means three out of every 100 people who saw your ad clicked it.
CTR is a leading indicator of ad relevance. High CTR tells the platform your ad resonates with the audience. Low CTR signals a mismatch between your creative, targeting, or offer and what people actually want to click.
On Google, CTR directly impacts Quality Score, which determines your ad rank and cost per click. A higher CTR can lower your CPC and improve your ad position. On Meta, CTR influences the delivery algorithm — ads with better engagement get shown more often at a lower cost.
But CTR alone is misleading. A 5% CTR with a 0.3% conversion rate costs you more than a 2% CTR with a 2% conversion rate. Always pair CTR with conversion rate and cost per acquisition when you judge performance.
Sarah runs a beauty brand. She was proud of her 4% CTR on TikTok — until she checked conversion. The clicks were cheap, but almost none turned into customers. Her actual cost per customer was $120, way above her $40 target. High CTR masked a fundamental problem: the wrong audience was clicking.
Average CTR for Ecommerce Across All Platforms (2026 Benchmarks)
The average CTR for ecommerce in 2026 sits in the 2-3% range, but that average hides dramatic platform differences.
Here's what the data shows across H1 2026 (April 7 - July 8), sourced from CreatiVault Market Insight:
Facebook leads in both CTR and spend share. 78% of ecommerce ad dollars go to Meta platforms, and the 3.30% CTR shows why — it delivers consistent clicks across a broad range of categories.
Snapchat sits at 2.97%, nearly matching Facebook despite accounting for less than 1% of ad spend. The younger demographic and full-screen ad format drive engagement, but most brands haven't tested it yet.
Google comes in at 2.38%, which looks lower until you break it down by campaign type. Search ads hit 3.17%, while Shopping and Display pull the average down. Google's strength is high-intent traffic, not broad discovery.
TikTok ranks last at 2.17%. The platform excels at brand awareness and viral content, but getting people to click out to a landing page is harder. TikTok users want to stay on TikTok.
See real-time CTR benchmarks across 150+ countries in CreatiVault Market Insight →
Average CTR by Platform: Deep Dive
Facebook & Instagram CTR for Ecommerce
The average CTR for ecommerce on Facebook and Instagram is 3.30% in H1 2026, based on CreatiVault Market Insight data.
This is substantially higher than older industry benchmarks, which typically cited 0.9-1.5% for ecommerce. The gap comes from two factors: better creative formats (Reels, Stories) and improved targeting after Meta's privacy changes forced the algorithm to get smarter.
What counts as "good" depends on the placement. Feed ads should hit 1.5% minimum. Stories and Reels should clear 2%. If you're below 1%, your creative isn't working or your audience is too broad.
Facebook captures 78% of ecommerce ad spend for a reason. The platform handles discovery shopping better than anyone else. People scroll looking for inspiration, and a well-targeted ad feels like content, not interruption.
Google Ads CTR for Ecommerce
The overall average CTR for ecommerce on Google is 2.38% in H1 2026. But Google isn't one platform — it's three, and CTR varies wildly by campaign type.
Search ads hit 3.17% because the intent is already there. Someone typing "best running shoes for flat feet" is ready to click. A good Search CTR sits between 3-6% for non-branded terms. Branded queries can hit 15-25%.
Shopping ads land at 0.86%. That sounds low, but it's right at the benchmark (0.85-1.2% is the normal range). Shopping ads compete on price and product image in a crowded carousel, so CTR is naturally lower. What matters more is conversion rate once they click.
Display ads come in at 0.46%. Anything above 0.5% is solid for Display. These are cold audiences seeing banner ads — you're paying for reach, not clicks.
Google's advantage is high-intent traffic. The CTR might be lower than Facebook on average, but the clicks convert better because people are actively searching for solutions.
TikTok Ads CTR for Ecommerce
The average CTR for ecommerce on TikTok is 2.17% in H1 2026.
TikTok's challenge is getting people to leave the app. Users come to TikTok to scroll videos, not shop. When an ad tells them to "click the link," it breaks the flow.
Creative format matters more on TikTok than any other platform. UGC-style content that looks native performs 2-3x better than polished product demos. The best TikTok ads don't look like ads at all.
A good TikTok CTR for ecommerce is 1.5% or higher. If you're below 1%, your creative is too salesy or you're targeting the wrong audience.
Category fit is critical on TikTok. Impulse purchases and trend-driven products perform well. High-consideration purchases struggle. We'll see this play out in the category breakdown below.
Snapchat Ads CTR for Ecommerce
The average CTR for ecommerce on Snapchat is 2.97% in H1 2026.
This is the surprise performer. Snapchat's CTR nearly matches Facebook, despite holding less than 1% of ecommerce ad spend.
The full-screen format forces engagement. There's no feed to scroll past — your ad takes over the entire screen. The audience skews younger (18-34), which favors impulse categories like beauty, fashion, and lifestyle products.
Most brands overlook Snapchat because the audience is smaller and the creative production feels different. But if your product fits the demographic, the CTR and cost-per-click can beat Facebook by 30-40%.
Average CTR by Ecommerce Category (2026 Data)
Platform averages only tell half the story. Category performance shows where the real opportunity lives — and where your budget is wasting.
Beauty & Cosmetics CTR Performance
Beauty products show the most dramatic platform variation in all of ecommerce.
Google dominates with a 19.39% CTR — more than 8x the overall ecommerce average and 37x higher than TikTok. This isn't a small difference. It's a fundamental mismatch between platform and category.
Why does Google crush it for Beauty? High search intent meets visual product research. Someone searching "best foundation for oily skin" is ready to compare options and click. Beauty is a high-consideration purchase where people want to read reviews, compare shades, and see before-after photos before they buy.
Facebook sits at 5.78%, which is still strong. The visual nature of beauty content works well in feed and Stories. Product demos, influencer UGC, and tutorials drive clicks. 54% of Beauty ad spend goes to Facebook, and the CTR justifies it.
TikTok struggles at 0.52% — the lowest CTR in the entire dataset. At first, this looks confusing. TikTok is full of beauty content. Makeup tutorials go viral every day.
The problem is behavior. People watch beauty content on TikTok for entertainment, not shopping research. They want to see the transformation, not click through to a landing page. TikTok beauty ads work for brand awareness and engagement, but converting that attention into clicks requires a completely different creative approach than Google or Facebook.
Sarah runs a beauty brand and was spending 60% of her budget on TikTok because "that's where beauty content lives." Her CTR was stuck at 0.52%, right at the benchmark — which meant she wasn't failing, the platform fit was wrong.
After seeing the benchmark data, she shifted 40% of her budget from TikTok to Google Search, targeting product-specific keywords like "cruelty-free mascara" and "vitamin C serum for dark spots." Her CTR jumped from 0.52% to 18% in the first week. Cost per acquisition dropped 60%.
FMCG (Fast-Moving Consumer Goods) CTR
FMCG products — paper towels, cleaning supplies, snacks, beverages, personal care basics — show the clearest platform fit in all of ecommerce.
Google delivers a 9.12% CTR for FMCG, with 100% of ad spend concentrated on that platform during the H1 2026 measurement period.
This makes sense. FMCG purchases are replenishment behavior, not discovery. People search for "Tide pods bulk" or "Clorox wipes" when they run out. They know the brand. They know the product. They just want to buy it fast.
Social platforms struggle with FMCG because there's no discovery aspect. No one scrolls Facebook hoping to find a new brand of toilet paper. The product isn't visual or aspirational. It's functional.
Marcus runs an FMCG brand selling eco-friendly cleaning products. He tested Meta ads and saw a 2% CTR, which looked decent on paper. But conversion was terrible — a 0.4% CVR — because people weren't in the right mindset.
When he moved to Google Search, targeting brand + product keywords ("EcoClean all-purpose cleaner"), his CTR jumped to 9% and conversion hit 4.2%. His cost per customer dropped 40% even though the CPC was higher, because the entire funnel tightened up.
Fashion & 3C Electronics CTR
The data shows no significant activity for Fashion or 3C Electronics (consumer electronics) during the April-July 2026 measurement period.
This doesn't mean these categories don't advertise. It means ad spend shifted during this timeframe, likely due to seasonal factors or budget reallocation.
Fashion typically performs well on Meta, with historical data showing around 2.84% CTR on Facebook and Instagram. The visual, aspirational nature of fashion content fits the discovery shopping behavior of social platforms.
Electronics show split performance: high-ticket items (laptops, phones) perform better on Google where people research specs and compare prices. Accessories and impulse electronics (phone cases, earbuds) do better on social where visual appeal drives clicks.
The Platform-Category Fit Framework
The biggest takeaway from the 2026 data: platform-category fit determines CTR more than any creative optimization.
You can have perfect targeting, great copy, and a beautiful ad — but if you're running Beauty on TikTok instead of Google, you're fighting a structural disadvantage. The 37x performance gap between Google (19.39%) and TikTok (0.52%) for Beauty isn't a creative problem. It's a fit problem.
Here's how the major ecommerce categories map to platforms:
The framework works in two directions. First, match your category to the platform where purchase intent is highest. Second, test the secondary platform with a small budget to confirm or challenge the assumption.
Beauty brands should default to Google, then test Facebook. FMCG brands should start with Google Search and stay there until unit economics justify testing social. Fashion brands should lead with Meta, test TikTok for trend-driven capsule collections, and skip Google Search unless they have strong brand query volume.
Compare your CTR against real category benchmarks in CreatiVault Market Insight →
How to Interpret Your Ecommerce CTR
Compare Apples to Apples
Most benchmark comparisons fail because they mix categories, platforms, and funnel stages.
A 1.5% CTR on Google Display is strong. The same number on Facebook Feed is below average. A 3% CTR on a cold prospecting campaign is excellent. On a retargeting campaign where people already know your brand, 3% is underwhelming.
Before you declare your CTR good or bad, align on three factors:
- Platform: Google Search, Shopping, and Display are three different benchmarks. Meta Feed and Stories are two different benchmarks. Use the right comparison.
- Category: Your CTR benchmark should match your product category, not the overall ecommerce average.
- Funnel stage: Cold prospecting (awareness), warm audiences (consideration), and retargeting (conversion) each have different CTR expectations.
CTR Benchmarks by Campaign Goal
When Low CTR Is Actually Fine
Low CTR isn't always a problem. Three situations where it doesn't matter:
High-AOV products: Luxury goods, furniture, jewelry — people don't impulse-click a $2,000 sofa. A 0.8% CTR with a 3% CVR on a $1,500 product can be excellent unit economics.
Video view campaigns: If you're optimizing for watch time and brand recall, not clicks, CTR is the wrong metric entirely.
Google Display brand awareness: Display CTR below 1% is normal and expected. You're paying for impressions, not clicks. Judge by CPM and reach, not CTR.
How to Improve Your Ecommerce CTR
Optimize for Platform-Category Fit First
Before you test new creative or adjust targeting, check whether you're on the right platform.
Run the fit test: take your category and compare it against the framework above. If you're a Beauty brand with more than 30% of spend on TikTok, shift 20% to Google Search for one month and measure the CTR difference.
Platform fit is the highest-leverage lever. A 37x CTR difference isn't something you optimize your way out of.
Test Creative Formats by Platform
Each platform rewards different formats:
- Facebook/Instagram: Short video (15-30s), Reels, carousel for product comparison, single image with strong copy
- Google Search: Headline testing — lead with the benefit or price point, match search intent in the ad copy
- Google Shopping: Product image quality and title optimization drive CTR more than any other factor
- TikTok: UGC-style content that looks organic, problem-solution hooks in the first 3 seconds, native captions and sounds
- Snapchat: Full-screen video, swipe-up CTA that's immediate and low-friction
Sharpen Audience Targeting
Broad targeting with a weak CTR tells you the audience is wrong. Narrow the audience first, then scale what works.
For cold audiences, start with interest stacking — layer 2-3 relevant interests rather than one broad category. For warm audiences, build lookalikes from your highest-LTV customers, not all buyers.
One targeting mistake that kills CTR: building lookalikes from clickers instead of converters. Your lookalike becomes a copy of people who click but don't buy.
Test Your Hook and Offer
On every platform, the first 3 seconds determine CTR. The hook is everything.
Three hooks that consistently outperform across ecommerce categories:
- Problem first: "Still dealing with [specific pain point]?"
- Result first: "How I went from [bad state] to [good state] in [timeframe]"
- Specific number: "19,000 women switched to this foundation in April. Here's why."
Test one variable at a time. Change the hook, keep everything else constant. Measure CTR change after 500+ impressions.
Using CreatiVault Market Insight for Real-Time Benchmarks
The problem with most benchmark articles — including ones from major platforms themselves — is the data is 6-12 months old by the time you read it.
The data in this article is from April 7 to July 8, 2026. That's a 3-month window of live market behavior. By Q4 2026, the platform averages will shift. Beauty on Google might climb higher. TikTok might improve its click-through mechanics. New ad formats change the numbers.
CreatiVault Market Insight tracks CTR, CPM, and CPA benchmarks in real time across 150+ countries and four major platforms. You can filter by category, platform, and region to see exactly what the benchmark looks like for your specific business, not the overall average.
The practical workflow:
- Filter Market Insight by your product category
- Select the platforms you're running on
- Compare your actual CTR against the live benchmark
- Identify the platform-category fit gap
- Reallocate budget toward the highest-fit platform
The teams that win at paid social don't guess at benchmarks. They check the data before they move budget.
Access live CTR benchmarks by category and platform →
Ecommerce CTR FAQ
What is a good CTR for ecommerce?
The average CTR for ecommerce in 2026 is 2-3% across platforms, but "good" depends on your platform and category. Facebook averages 3.30%, Google 2.38%, and TikTok 2.17%. For category-specific benchmarks: Beauty on Google hits 19.39%, FMCG on Google reaches 9.12%, and Fashion on Meta sits around 2.84%. Compare your CTR against the right platform-category combination, not the overall ecommerce average.
Why is my ecommerce CTR lower than benchmarks?
Four common causes: platform-category mismatch (running Beauty on TikTok instead of Google), weak creative hook in the first 3 seconds, audience too broad or misaligned, or ad fatigue from showing the same creative too long. Check platform fit first — a structural mismatch won't get fixed by creative optimization. If platform fit is right, test new hooks and narrow your audience before you scale spend.
Should I optimize for CTR or conversion rate?
Both, but conversion rate matters more for unit economics. A 3% CTR with a 0.5% CVR costs more per customer than a 2% CTR with a 2% CVR. High CTR just means your ad is relevant. High CVR means your landing page and offer are relevant. Optimize CTR to lower your cost per click, then optimize CVR to lower your cost per acquisition. Never chase CTR alone.
How does ecommerce CTR differ by platform?
Facebook leads at 3.30%, followed by Snapchat at 2.97%, Google at 2.38%, and TikTok at 2.17% (H1 2026 data). But category fit changes everything. Beauty on Google hits 19.39% while TikTok struggles at 0.52% — a 37x difference. Platform behavior drives CTR: Google captures search intent, Facebook drives discovery shopping, TikTok favors engagement over clicks. Match your category to the platform with the highest purchase intent for that product type.
Is a 1% CTR bad for ecommerce?
Depends entirely on the platform and campaign type. On Google Display, 1% is excellent — the average is 0.46%. On Facebook Feed, 1% is below the 3.30% benchmark. For awareness campaigns with cold audiences, 1% might be acceptable. For retargeting campaigns, 1% is weak — you should hit 5%+ when people already know your brand. Match your CTR to the platform and funnel stage, not a universal standard.
Conclusion
Platform and category determine CTR more than creative, targeting, or any single optimization tactic.
The average CTR for ecommerce in 2026 ranges from 2.17% on TikTok to 3.30% on Facebook, but those platform averages hide the real insight: Beauty performs 37x better on Google (19.39%) than on TikTok (0.52%). FMCG hits 9.12% on Google with 100% of spend concentrated there. Platform-category fit is the entire game.
Most benchmark articles give you last year's data and call it current. This article gives you H1 2026 performance from real ad spend across four platforms. Use it to check whether your CTR is actually good or bad — not against the overall average, but against your specific platform and category combination.
Three action steps:
- Benchmark your CTR against the right comparison: Match platform, category, and funnel stage before you judge performance.
- Test platform-category fit before you optimize creative: If you're a Beauty brand spending heavily on TikTok, shift 20% to Google Search and measure the CTR difference over 30 days.
- Track performance against real-time benchmarks: Use live data to catch shifts in platform performance before your competitors do.
Jenny runs a fashion brand and sees a 2.8% CTR on Meta — right at the benchmark. When she tested Google Shopping, her CTR dropped to 0.8%. She learned platform fit matters more than optimization. Fashion lives on social discovery, not search. She stopped trying to "fix" her Google CTR and doubled down on Meta, where the structure already worked.
The teams that win don't chase universal benchmarks. They find the platform-category fit where the structure works in their favor, then they optimize from there.
Compare your CTR to live 2026 benchmarks in CreatiVault Market Insight →
---
Sources
- CreatiVault Market Insight (H1 2026 data, April 7 - July 8, 2026): Platform CTR benchmarks by ecommerce category
- WordStream Google Ads Benchmarks 2025: Google Search, Shopping, Display CTR averages
- TopGrowthMarketing CTR Guide: Meta and Google ecommerce benchmarks
- Meta Business benchmarks: Facebook and Instagram ad performance data